How to Embed Maps in Client Reports (and Tag Them)
How to Embed Maps in Client Reports (and Tag Them)

To embed a map in a report or web page, you have two routes. For a single place or search, build a Maps Embed API URL and drop it into an iframe. For several locations with custom markers, make a Google My Maps map public and paste its embed code. Either way, a pin only shows where a business is. If the report needs to show where a business ranks, you need a map of ranking data, and that is a different job.
This guide covers all three: the embed steps, what to check before you publish, how to tag and organize reports for many clients, and how to present local ranking data so a client can read it.
TL;DR
- Use the Maps Embed API for one place, a search or directions. Use Google My Maps for several locations with your own styling.
- Google My Maps maps are private by default. Set sharing to public before the embed code will work for your client.
- Restrict your API key and set a referrer policy so the embed keeps working and nobody else can use your key.
- Tag every report with client, period and report type, and put the same elements in the file name.
- An embedded map shows where a business is. A grid scan shows where it ranks, block by block. Use both for different jobs.
Table of Contents
- Three kinds of map you can put in a report
- Embedding a Google Map with the Maps Embed API
- Embedding a custom map with Google My Maps
- What to check before you send the report
- Tagging client reports so nothing gets lost
- Showing ranking data on a map
- A simple report layout that works
- Perspective: why we think the map should be the report
- Run grid scans for your clients with Maprank
- FAQ
- Sources
Three kinds of map you can put in a report
People say “embed a map” and mean three different things. Pick the right one first, because each has its own setup and limits.
| What you want to show | Best tool | Setup effort | Interactive? |
|---|---|---|---|
| One business location, a search result or directions | Maps Embed API (iframe) | Low, needs an API key | Yes |
| Several locations, service areas, custom markers and labels | Google My Maps | Low, no code | Yes |
| Where a business ranks across a service area | Grid rank scan | Depends on the tool | Reports usually show it as a heatmap |
Google’s own documentation positions the Maps Embed API as a way to add interactive maps and Street View panoramas to a page with a simple HTTP request. Google My Maps, by contrast, suits multiple locations in a customized style, including markers, labels and lines.
The third row is the one most agency reports miss. A pin on a map confirms an address. It says nothing about visibility.
Embedding a Google Map with the Maps Embed API
This route is best when the report lives on a web page, such as a client portal or a landing page you control.
- Get an API key. Create a key in the Google Cloud console. Google states that Maps Embed API requests are free with unlimited usage, but you still need a valid key.
- Pick a mode. The API offers five modes: place, view, directions, streetview and search.
- Build the URL. The location goes in the required
qparameter, which accepts a URL-escaped place name, address, plus code or Place ID. - Add the iframe. Use the URL as the iframe’s
src. Size it at least 200 by 200 pixels, per Google’s embed guide.
A place-mode embed looks like this in structure: an iframe with a width, a height, a src that starts with the Maps Embed endpoint, your key, and q set to the business name and city. Swap in the Place ID when the name is common, because the ID points to exactly one listing.
Restrict the key before you publish
An unrestricted key sitting in page source can be copied by anyone. Google recommends applying API key restrictions to prevent unauthorized use. If your restriction is by website, set the iframe referrerpolicy (for example, strict-origin-when-cross-origin) so Google can validate the request against that restriction.
Keep one key per client site where you can. If a client leaves, you retire that key without touching the others.
Embedding a custom map with Google My Maps
No code is needed here, which makes it the friendlier option for account managers who do not want to touch HTML. It works well for a map of a client’s service locations, competitor positions you have researched, or a neighborhood-by-neighborhood plan.
- Build the map in Google My Maps, adding layers, markers and labels.
- Open Share, then Who has access, then Change, and set the map to public on the web. Google’s tutorial notes that these maps are private by default, visible only to the creator until you change sharing.
- Choose Embed on my site and copy the HTML.
- Paste the HTML into your page source and adjust the height and width.
The common failure is a blank or “request access” box in the report. Nine times out of ten the map is still private. Open the page in a private browser window to see what your client will see.
One decision to make deliberately: a public map is public. Do not put anything in it you would not want a competitor to find, such as internal notes in marker descriptions or a client’s unpublished expansion sites.
What to check before you send the report
Run this list before every client-facing page or PDF goes out.
- Access. Does the map load in a logged-out browser?
- Key restrictions. Is the key restricted, and does the embed still load on the live domain, not just on staging?
- Labels. Does the map carry a title that says what it shows and for which date?
- Privacy. Are there client details in marker names or descriptions?
- Mobile. Is the iframe responsive, or does it overflow a phone screen?
- PDF export. Interactive embeds usually do not survive a PDF. Add a static screenshot with the date next to it.
That last point matters for agencies who deliver both a live page and a downloadable file. The live embed is for exploring. The screenshot is the record.
Tagging client reports so nothing gets lost
Once you run more than a handful of clients, the map is the easy part. Finding the right report in March is harder. A simple tag and naming scheme fixes most of it.
Pick the tags once and use them everywhere
Use the same small set of elements for folders, file names and any labels your reporting setup supports:
- Client (a short code, not the full legal name)
- Report type (for example: ranking, GBP performance, monthly summary)
- Location or service area, where the client has more than one
- Period (month or quarter)
- Status (draft, sent, approved)
Name files so they sort themselves
One published convention is ClientCode_ProjectName_DocType_Date.pdf. The idea is that every deliverable traces back to a client and project without exposing confidential details, and putting the date last removes the need for “final_v3” suffixes. A ranking report for a plumber might read PLB014_MapRankings_Report_2026-10.pdf.
Keep each client in its own container
A flat list with every client’s reports mixed together is how the wrong report goes to the wrong person. Give each client its own folder or workspace, set sharing at the client level, and only then add tags on top. Tags are for finding things. Folders are for keeping things apart.
Showing ranking data on a map
Here is where an embedded pin map runs out. A client who asks “are we showing up?” needs a different picture than “here is our address.”
Local results change sharply with distance. A business can sit first for a keyword next to its shop and be invisible two miles away. That is why one reading from one city-center point can mislead. One agency guide argues that a grid-based visibility score across a service area is more honest than a single coordinate.
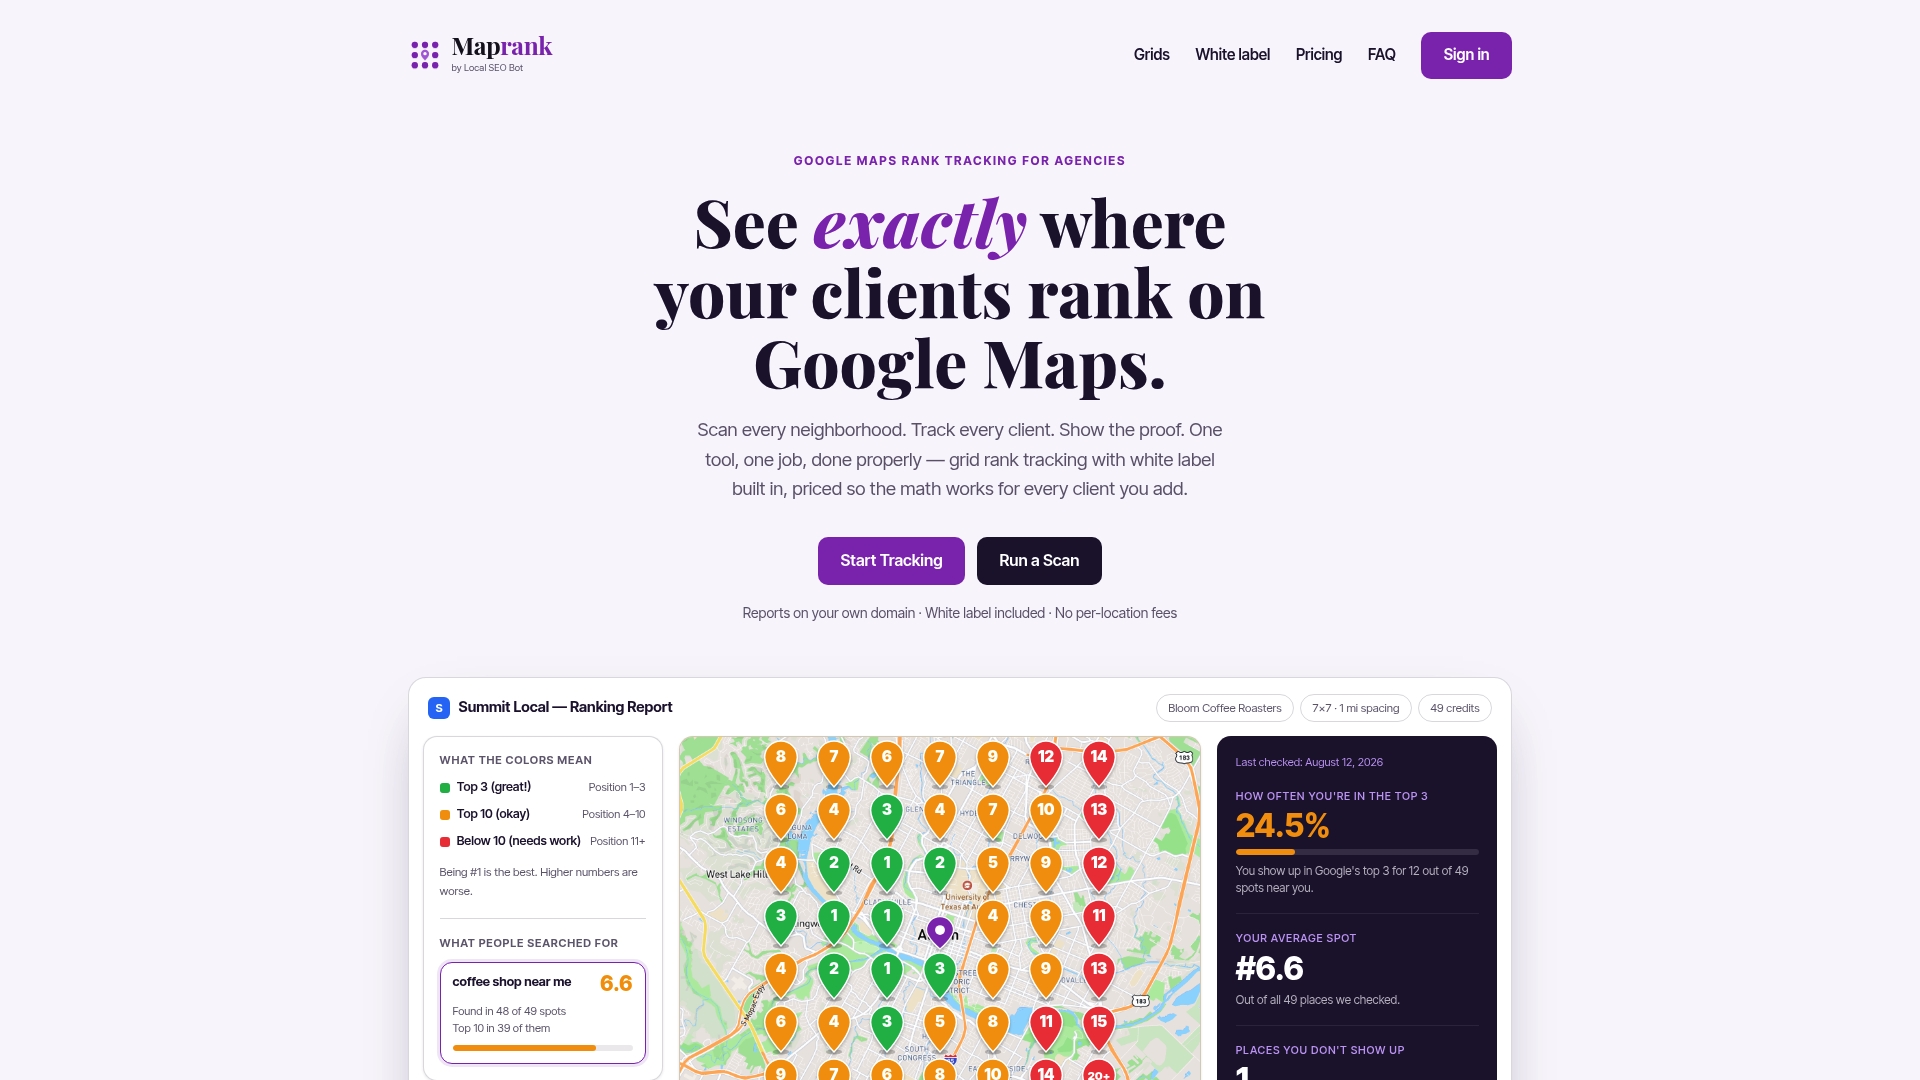
A grid scan checks the same keyword from many points around a business and colors each point by rank. The result is a heatmap: green where the business shows near the top, red or empty where it does not. Clients grasp it in seconds, and it points straight at the work: the neighborhoods where you are absent.
Make every number checkable
A heatmap with no context is easy to doubt. Write these next to it:
- The keyword that was scanned
- The center point and the grid size and spacing
- The date of the scan
- The business name as it appears on Google
If you change the keyword set or the grid between reports, say so. Comparing a 5 by 5 grid in October with a 9 by 9 grid in November tells the client nothing, and silent changes erode trust fast.
Tie the map to outcomes
Rankings are a means. Pair the heatmap with business actions from the Google Business Profile, such as calls, direction requests and website clicks, so the story reads: visibility grew here, and these actions followed. The same AAMAX guide describes combining map-based ranking evidence with profile engagement metrics to explain business outcomes. For the profile side of that story, this walkthrough of Google Business Profile optimization covers what to improve once the map shows where you are weak. And for the reporting side, this piece on SEO KPIs tied to revenue helps decide which numbers belong on the page at all.
If you want to go deeper on how grids work, our posts on the local SEO grid tracker and the geo grid approach to local rankings explain the method step by step.

A simple report layout that works
Here is a layout many agencies can reuse each month:
- One-line summary. What changed, in plain words.
- Heatmap for the main keyword, with this month next to last month, same grid, same settings.
- Two or three notes on what you did and what the map suggests doing next.
- Profile actions (calls, directions, clicks) for the same period.
- Scan conditions in a small footer: keyword, center, grid, date.
Keep it to a page or two. Clients read the top and the picture. Put the detail below for the ones who want it.
Perspective: why we think the map should be the report
We built Maprank because a pin and a single rank number do not describe how local search works. A business is visible in some blocks and absent in others, and the client deserves to see that.
Our view is that agencies should not have to count clients or locations to decide how much they can report. That is why every plan includes unlimited businesses and white label reporting, and why our pricing is built on scan credits rather than per-location fees. Adding a client or a teammate should not change what a report costs you.
We also think reports should carry your name, not ours. Maprank is designed to deliver branded reports on your own domain, and it does not ask for Google account connections to run scans. You choose the grid size and spacing, so the picture fits the client’s real service area.
A report that shows exactly where a business stands, in the neighborhoods that matter, is a report clients remember at renewal time.
Local
Run grid scans for your clients with Maprank
If your reports need more than a pin, Maprank gives you grid-based Google Maps rank tracking with customizable scan grids and white label reports. Every plan includes unlimited businesses and white label features, and pricing scales by scan credits, seats and grid size.
Plans are published at maprank.so: Solo is $19 per month ($228 per year), Agency is $39 per month ($468 per year), Pro is $79 per month ($948 per year) and Scale is $149 per month ($1,788 per year). If you only want to see a business’s ranking once, try the one-off Google Maps rank check. For the agency workflow, see how we approach local SEO reporting for agencies.
FAQ
Is it free to embed a Google Map in a report?
Google states that Maps Embed API requests are available at no charge with unlimited usage, but you must use a valid Google Cloud API key. Google My Maps is also a free tool for building maps you can embed. Check Google’s current documentation before launch, since terms can change.
Why does my embedded My Maps map show a permission error?
Google My Maps maps are private by default, so only the creator can view them. Change the share setting to public on the web, then copy the embed code again and test it in a private browser window.
How do I keep my API key from being misused?
Apply API key restrictions in the Google Cloud console, as Google recommends. If you restrict by website, set the iframe referrer policy, such as strict-origin-when-cross-origin, so the request can be validated.
What is the best way to tag client reports?
Use a short client code, the report type, the location if there is more than one, and the period. Repeat the same elements in file names, with the date last, so reports sort in order and never reveal more than they need to.
Can an embedded map show my client’s local rankings?
A standard embed shows places, not rankings. To show where a business ranks across a service area, use a grid scan and put the resulting heatmap in the report with its keyword, grid settings and scan date.
Sources
- The Maps Embed API overview, Google for Developers
- Embed a map, Maps Embed API, Google for Developers
- Maps Embed API quickstart, Google for Developers
- Visualize your data on a custom map using Google My Maps
- Work with Google My Maps Embeds, Digital Experience
- Client file naming convention, Renamed.to
- How to Measure Local SEO ROI for Clients, AAMAX
- Google Business Profile Optimization: Your Complete Guide
- SEO Reporting in 2026: The KPIs That Actually Connect to Revenue
Recommended
- White Label Google Maps Reports: Send Beautiful Branded Maps Reports to Clients
- Google Maps Ranking Report Generator: Create Client-Ready Reports in Minutes
- Google Maps Rank Tracker for Agencies: Scale Local SEO Reporting for Every Client
- Google Maps Rank Tracker for SEO Agencies: Win Clients With Better Reporting