Pilot 3 Candidate Centers: Geogrid Center Selection for Agencies
Pilot 3 Candidate Centers: Geogrid Center Selection for Agencies

For most agency clients, the right grid center is a service-weighted centroid built from where customers actually convert, not the client’s mailing address or a city landmark. Google weighs distance heavily in local results, so a center that misrepresents customer geography produces a scan that flatters or punishes a business for the wrong reasons. The main exception is a brick-and-mortar business with steady walk-in traffic; in that case, the storefront address remains the better anchor.
TL;DR:
- Using a demand-weighted centroid provides the most accurate reflection of customer clusters but requires access to detailed booking or call data.
- For businesses with multiple markets, deploying several centers ensures a comprehensive view of ranking patterns across different regions.
- Tighter grid spacing benefits small, dense neighborhoods to capture local fluctuations, while wider spacing suffices for sprawling areas to save scan credits.
- Rerunning scans weekly or biweekly helps distinguish true ranking trends from random fluctuations in search results.
- Proper documentation of the selected center and its justification is essential for explaining ranking changes during client reporting.
Table of Contents
- Choosing the right center-selection method for each client
- A step-by-step workflow to pick, pilot, and document the center
- Grid size, spacing, and API limits that shape your results
- Validating scan outputs and reading what the center is telling you
- A pre-scan checklist and the mistakes to avoid
- Center selection is measurement design, not guesswork
- How Maprank fits into a center-selection workflow
- Where these figures and guidelines come from
- Sources
- FAQ
Choosing the right center-selection method for each client
Every client’s geography calls for a different starting point, and picking the wrong one quietly skews every scan that follows.
- Business address centroid: best for storefronts, clinics, and restaurants where foot traffic matters and the address itself drives discovery.
- Service-area hub centroid: fits service-area businesses that hide their address on their Business Profile, such as plumbers or home cleaners, and should reflect the middle of their active job zone.
- Demand-weighted centroid: works when call tracking, booking data, or analytics show where paying customers cluster, even if that cluster sits away from the office.
- Multiple-center approach: necessary for businesses covering several towns or a sprawling metro, since one point can’t represent a polycentric market.
Each method trades precision for simplicity. A storefront address is easy to defend to a client but can undersell performance in the neighborhoods that actually generate revenue. A demand-weighted centroid is more accurate but requires data the client may not readily hand over. Multiple centers give the fullest picture but multiply the scans, and the credits, needed to keep reporting current.
Pro Tip: When a client can’t tell you where their best customers come from, ask for their last 20 job addresses or bookings before you pick a center.

A step-by-step workflow to pick, pilot, and document the center
A defensible center choice comes from a short, repeatable process rather than a guess made during onboarding.
- Run an intake checklist: collect the business address, stated service area, highest-value ZIP codes, and the neighborhoods the client mentions most.
- Do a rapid demand check: pull whatever analytics, call logs, booking clusters, or citation density data exists to see where customers already are.
- Generate three candidates: an address centroid, a service-area centroid, and a demand-weighted centroid, even for straightforward clients.
- Run small pilot scans: scan a limited grid around each candidate and compare rank spread before committing to one for ongoing tracking.
- Choose and document: pick a primary center, keep one or two alternates on file, and write down why each one was chosen.
The documentation step matters more than it looks. Agencies that skip it end up unable to explain a rank swing six months later when a client asks why their numbers moved.
- Keep a short note per client: center coordinates, method used, and the data point that justified it.
- Store alternate centers so a rerun doesn’t require rebuilding the case from scratch.
This sequence mirrors how a grid scan reveals ranking patterns across a full service area rather than a single point, and it gives agencies a paper trail for every reporting cycle.
Grid size, spacing, and API limits that shape your results
Center selection doesn’t happen in a vacuum. The technical limits of grid tools and the underlying mapping APIs decide how much resolution you actually get.
- Google’s Nearby Search documentation defines the search area as a circle with a center point and a radius, and both are required parameters in every request.
- Tighter spacing between grid points, meaning fewer meters between each scan location, catches hyper-local swings but multiplies the number of scans needed to cover the same area.
- Wider spacing smooths out noise but can miss a pocket where a competitor dominates just two blocks over.
- Smaller neighborhoods typically need a tighter, smaller-radius grid, while metro-wide clients need a wider footprint with fewer points per square mile to stay within a reasonable scan budget.
- Scan frequency has a direct credit cost, so denser grids or more frequent reruns should be reserved for clients where the extra resolution changes a real decision.
Google’s help documentation confirms that location estimation for searchers can rely on precise device-based signals or a broader area estimate, and that broader estimate can cover more than 3 square kilometers in some regions. That gap alone explains why a scan centered on a coarse city point can misrepresent what an actual nearby searcher sees.
Validating scan outputs and reading what the center is telling you
A single scan rarely tells the whole story. Compare rank slices from the same grid across multiple dates and across your candidate centers to see which gaps are persistent rather than a one-day fluctuation.
- Treat isolated dips at one or two grid points as local anomalies worth a second look, not a business-wide problem.
- Treat a consistent low-rank band across a whole side of the grid as a signal that the underlying profile needs work.
- Map each pattern to a fix: patchy visibility often points to thin citations or missing categories, while area-wide weakness usually traces back to NAP inconsistency or weak on-page signals.
- Rerun scans on a fixed schedule, weekly or biweekly, so you can separate a real trend from scan-day noise.
Pro Tip: Before telling a client their rankings dropped, rerun the same grid a second time on the same day. If the pattern holds, it’s real; if it doesn’t, it was noise.
A pre-scan checklist and the mistakes to avoid
A few habits separate a reliable grid program from one that generates confusing, contradictory reports.
- Document both the chosen center and any alternates directly in client-facing reports so nobody has to guess later why a number moved.
- Avoid defaulting to a city centroid for any client covering more than a single neighborhood.
- Match spacing to the question you’re answering: don’t over-sample a small service area just because credits allow it.
- Respect the fact that Google’s location handling includes privacy protections, and disclose to clients that a scan is an estimate, not a guarantee of what every searcher sees.
| Mistake | Why it fails | Better practice |
|---|---|---|
| Using a city centroid for a metro-wide client | Averages away real neighborhood differences | Use a service-area or demand-weighted centroid |
| Over-dense spacing on a small area | Wastes scan credits on redundant points | Match spacing to the size of the actual service zone |
| Reporting one scan as final | Can’t distinguish a trend from a one-day blip | Rerun scans on a fixed cadence before drawing conclusions |
| Skipping documentation | Leaves no answer when a client asks about a rank change | Log center choice and rationale at intake |
Center selection is measurement design, not guesswork
Choosing a grid center is really a measurement decision. The point you pick determines what “ranking well” even means for that client, so it has to align with where their revenue actually comes from, not with the tidiest looking map. When a demand-weighted centroid shows weak coverage in a client’s highest-value ZIP code, that’s a direct line to a lead-generation conversation, not just a rank number. Treat every grid as a proxy for revenue exposure, and the reporting writes itself.
— Local
How Maprank fits into a center-selection workflow
Running the workflow above by hand is manageable for one client. It gets tedious fast across a full roster, which is where the tooling matters more than the theory.
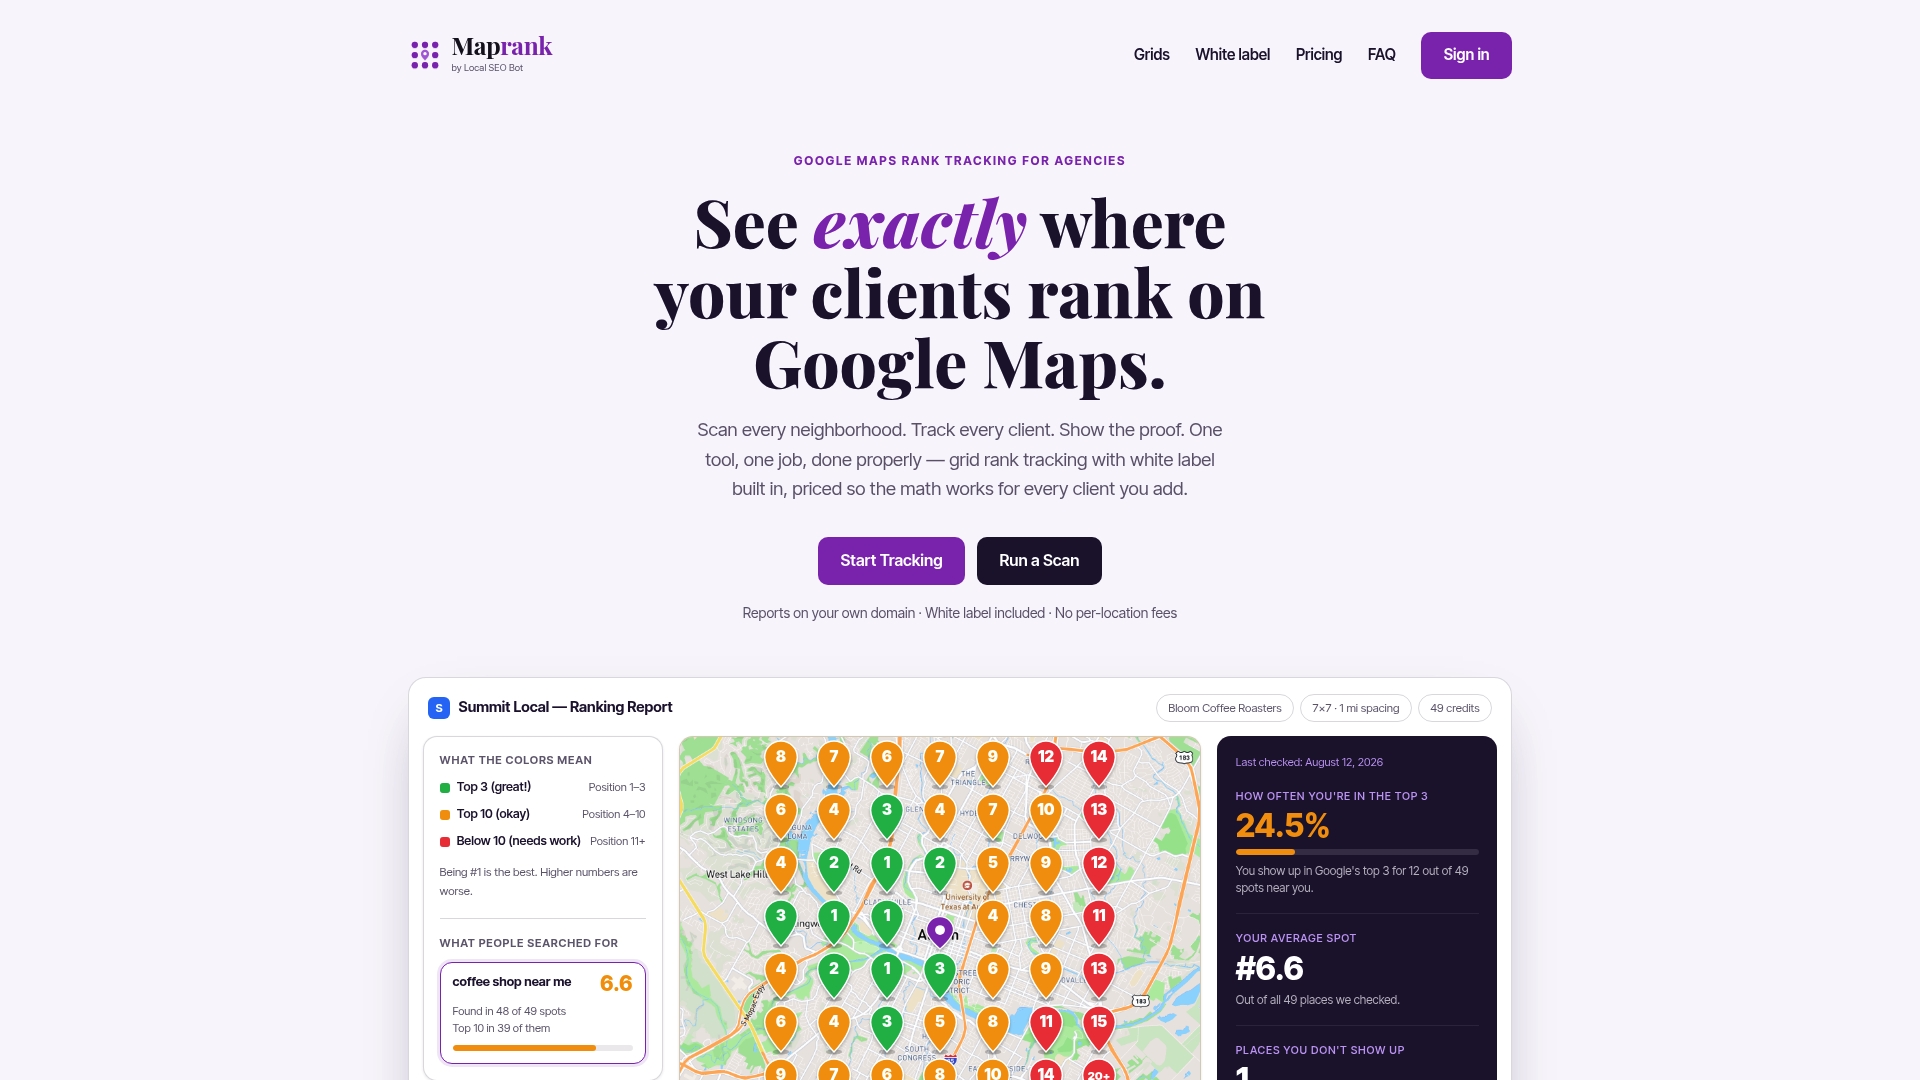
- Customizable grid size and spacing allow a pilot around each candidate center to be completed efficiently.
- Many businesses can be tracked, which helps when testing multiple centers per client across several accounts.
- White-label reporting is available, allowing reports to appear as coming from the agency’s own domain.
- No Google account integrations are needed, simplifying client onboarding during the pilot phase.
Start with a one-off rank check centered on your top candidate, then compare it against an alternate before committing to a recurring schedule.
Where these figures and guidelines come from
The distance, radius, and location-estimation details above come from Google’s own documentation and patent filings, linked in context throughout this article.
- Google Business Profile local ranking guidance
- Google Search location handling
- Places API nearby search parameters
- Patent on location prominence scoring
Sources
- Tips to improve your local ranking on Google - Google Business Profile Help
- Understand & manage your location when you search on Google - Google Search Help
- Nearby Search (New) | Places API | Google for Developers
- US8046371B2 - Scoring local search results based on location prominence - Google Patents
FAQ
Should I use multiple centers for one client’s grid scan?
Yes, for any client covering more than one neighborhood or town, running scans around two or three candidate centers gives a truer picture than a single point. A polycentric service area almost always shows different rank patterns depending on where the grid is anchored.
How often should I rerun a grid scan after picking a center?
A weekly or biweekly cadence is enough to separate a real ranking trend from day-to-day noise. Once a baseline is established over several cycles, you can safely space out reruns unless the client makes a major change to their Business Profile.
Should I center the grid on the business address or a centroid?
Use the business address for storefronts with walk-in traffic, since that address is the real anchor point customers search from. For service-area businesses that hide their address, a centroid built from the active job zone reflects where customers actually are, as described in Google’s guidance on local ranking factors.
How tight should grid spacing be for a small neighborhood?
Tighter spacing, meaning fewer meters between scan points, is worth the extra scans in a small, dense neighborhood where competitors sit just blocks apart. For a metro-wide service area, wider spacing keeps the scan budget reasonable without losing the overall pattern.
How do I explain center choice to a client in a report?
State the method used, whether it’s the business address, a service-area centroid, or a demand-weighted point, and the data that justified it, such as call clusters or top ZIP codes. Framing it this way turns a technical decision into a transparent part of the client’s report rather than an unexplained number.