5x5 Geo Grid Google Business Profile Audit for Agencies
5x5 Geo Grid Google Business Profile Audit for Agencies

A google business profile audit that actually holds up under client scrutiny is a geo-grid Google Maps ranking scan—not a single spot check. It samples dozens of coordinates across a service area to show exactly where a business ranks in the local 3-pack, neighborhood by neighborhood, then ties those rankings to GBP Insights actions like phone calls, direction requests, and website clicks. The payoff is a report built on Average Map Rank and 3-pack coverage percentages that a client can actually see and believe, which is what makes a monthly retainer easy to renew.
TL;DR:
- A geo-grid Google Maps ranking scan provides a comprehensive view of local visibility by sampling dozens of coordinates, rather than relying on one spot check.
- Metrics such as Average Map Rank and percent of grid points in the local 3-pack directly correlate to visibility and potential customer actions like calls and directions.
- Consistent grid size and scheduling based on service area, along with pairing scans with GBP Insights exports, ensure accurate, comparable trend data.
- Heatmaps identify specific weak spots linked to proximity, category mismatch, or review velocity, guiding targeted improvements.
- Automating monthly scans and reports with dedicated tools reduces workload, enhances credibility, and shifts client discussions from rankings to tangible local growth.
Table of Contents
- What Metrics Belong in a Grid-Based Local SEO Audit?
- How Do You Design a Geo-Grid and Schedule Scans?
- Turning Heatmap Weak Spots Into a Client Action Plan
- What Should a Client-Facing Audit Report Include?
- Building a Repeatable Monthly Audit Workflow
- Why Grid Audits Change the Client Conversation
- Running Grid Audits Without the Reporting Headache
- Sources
What Metrics Belong in a Grid-Based Local SEO Audit?
Average Map Rank (AMR) is the backbone metric. Run a 5x5 grid, 25 points total, and if a business ranks 2nd, 4th, 1st, 9th, and 3rd in five sampled cells, you average those positions across the full grid to get a single number that represents visibility across the whole service area, not just city center. An AMR of 3.2 tells a client far more than “you rank #1 downtown.”
Percent in the local 3-pack matters just as much, because most map searchers only ever see those top three listings. A business can post a strong AMR and still miss the 3-pack in half its grid, which is the gap that actually costs phone calls.
GBP Insights break the story into two buckets: discovery actions (calls, direction requests, and website clicks from people who found the business through a search, not a name lookup) and direct actions (people who already knew the brand). A proper Google Maps ranking report connects optimization work to these outcomes, which is the difference between a ranking chart and a business case.
Consider building a simple Local Visibility Index, a share-of-voice score across your grid’s total possible top-3 slots, to track momentum without naming who else occupies those slots.
Pro Tip: Flag any week with unusual SERP volatility (a local pack reshuffle, a Google update) directly in your report notes so a dip doesn’t get blamed on the client’s own campaign.
Metrics to log every cycle:
- Average Map Rank (AMR) across the full grid
- Percent of grid points showing the business in the local 3-pack
- GBP discovery actions: calls, direction requests, website clicks
- Grid-level Local Visibility Index (share of top-3 slots)
- Any SERP volatility flags for the reporting period
How Do You Design a Geo-Grid and Schedule Scans?
A grid that’s too small hides underperformance at the edges of a service area. A grid that’s too large burns scan credits on zip codes nobody searches from. Match grid size to footprint instead of guessing.
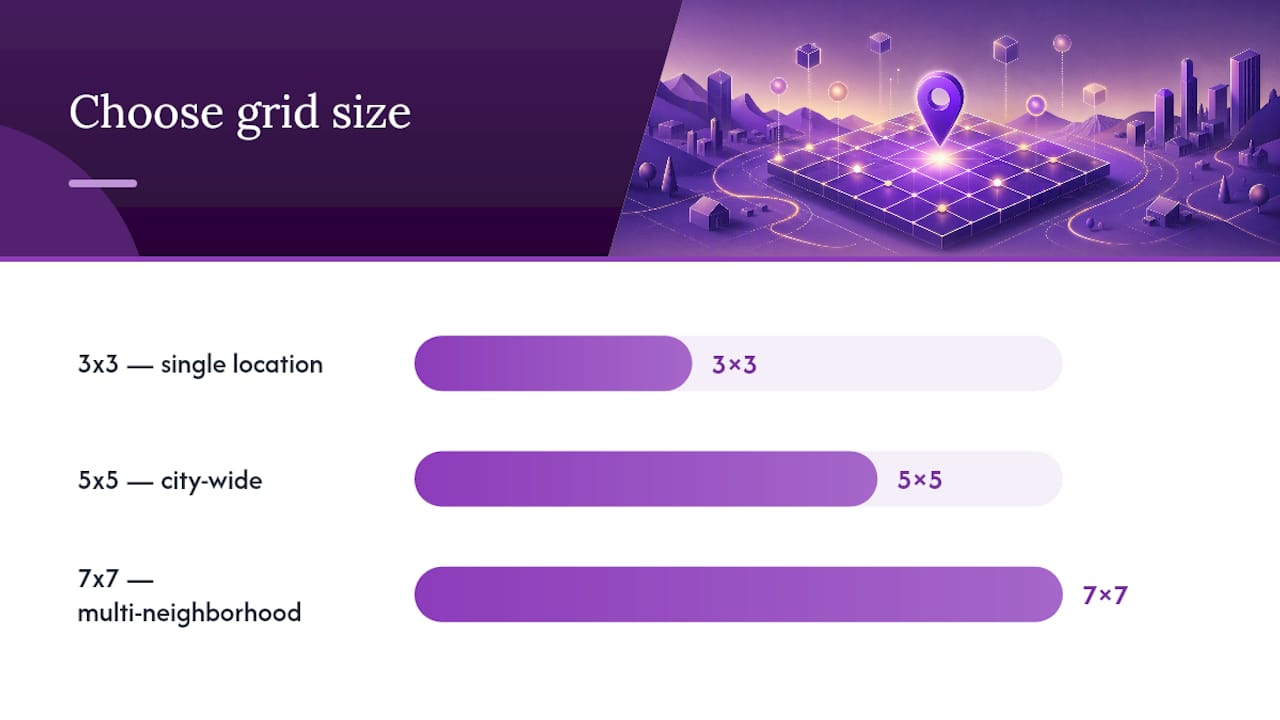
- Pick a grid size. A 3x3 grid suits a single-location business with a tight two-mile radius. A 5x5 grid is the workhorse for most local clients, city-wide coverage without excess. A 7x7 grid fits multi-neighborhood metros or service-area businesses spanning a whole county.
- Choose your center point. Center on the physical address for a storefront; center on the geographic centroid of the service area for plumbers, movers, or other service-area businesses with no walk-in location.
- Densify around opportunity zones. If a client’s revenue skews toward two specific neighborhoods, add extra grid points there even if it pushes past a clean square grid.
- Set your cadence. Weekly scans for active campaigns still building citations or reviews; monthly scans once a client hits maintenance mode.
- Name and store snapshots consistently. Use a convention like
ClientName_GridSize_YYYYMMDDso trend comparisons don’t require manual reconciliation later. - Pair each scan with a GBP Insights export covering the same date range, so ranking movement and action data always describe the same window.
Multi-location and service-area businesses need a separate grid per location; one shared grid across three branches will mask which one is actually underperforming.
Run scans on a consistent device profile and avoid logged-in personalization wherever your platform allows it, since a signed-in scan reflects that one browser’s search history, not an unbiased searcher view. A geo-grid scan run cleanly gives you a repeatable, comparable dataset month over month.
Turning Heatmap Weak Spots Into a Client Action Plan
A grid heatmap usually shows a visibility bubble around the business address that fades toward the edges. That fade pattern is normal. What matters is where it fades sharply and why.
A hard drop-off a mile from the storefront often points to proximity bias, Google simply favoring closer competitors in that cell. A patchy, inconsistent pattern with no geographic logic often signals a category mismatch or thin review velocity rather than distance. Heatmaps are one of the clearest ways to show a client where local link-building or a location-specific landing page would actually move the needle.
Common causes behind weak grid cells:
- Proximity: the business sits too far from that cell’s center for Maps to surface it
- Personalization gap: inconsistent NAP data confusing which listing is “the” business
- Category mismatch: primary GBP category doesn’t match what searchers in that area are typing
- Review velocity: nearby competitors are earning reviews faster
- Citation gaps: missing or inconsistent directory listings anchoring the business to that neighborhood
Sort weak cells into quick wins (missing categories, incomplete attributes, stale photos) versus structural fixes (a genuine review deficit, a link gap, a need for a neighborhood landing page). Attach a measurable target to each, something like “AMR improves from 6.1 to 4.5 in the northeast quadrant within 60 days.”
Pro Tip: Never hand a client a heatmap alone. Pair every red zone with one to three specific tasks, otherwise the visual just becomes a complaint, not a plan.
What Should a Client-Facing Audit Report Include?
Open every report with an executive summary that answers one question directly: did visibility expand this period? Framing the report around “did we win more of the neighborhood this month?” is what actually keeps clients renewing, because it translates rankings into a business outcome instead of an SEO metric.
Follow the verdict with two or three supporting bullets: the AMR trend, the 3-pack percentage shift, and the standout GBP action delta.
Visuals carry the rest of the report:
- Grid heatmap showing current-period visibility across sampled points
- Grid data table listing each sampled point and its rank
- AMR trend line across the last three to six scan cycles
- GBP action deltas: calls, direction requests, website clicks, period over period
| Report component | What it shows |
|---|---|
| Executive summary | One-line verdict plus supporting bullets |
| Heatmap | Visual coverage across the grid |
| Grid data table | Point-by-point rank detail |
| AMR trend sparkline | Momentum across scan cycles |
| GBP action deltas | Business outcomes tied to visibility |
Close with an appendix documenting grid parameters (size, center point, scan date and time) and methodology notes. That transparency is what separates a credible audit from a screenshot. Deliver it as a white-label PDF, a client portal snapshot, or condense it into a one-page owner summary for clients who won’t read past the first paragraph.
Building a Repeatable Monthly Audit Workflow
The operational rhythm behind a reliable retainer is simple: scan, sync, analyze, act, report. Skipping a step is usually what breaks the cadence three months in.
- Schedule the geo-grid scan on a fixed day each month (or weekly during active campaigns).
- Pull the GBP Insights export for the matching date range.
- Analyze the heatmap and metrics against the prior period.
- Prioritize and execute fixes, quick wins first, structural work logged for the next cycle.
- Generate and deliver the report, ideally from a template so formatting never eats billable time.
Automation is what makes this sustainable at scale. Agencies running scheduled scans and GBP syncs report cutting per-client production time from 60 to 90 minutes down to 5 to 10 minutes, which is the margin that makes a $500 to $1,000 retainer profitable instead of a time sink. Set SLA language up front, scan frequency, report turnaround, and the threshold that triggers an ad-hoc deep dive, so clients know what “monitoring” actually includes.
Why Grid Audits Change the Client Conversation
Single-point rank checks invite an argument every single month: the client Googles their own business, sees a different result than your report, and now you’re explaining personalization bias instead of talking about growth. A grid audit ends that argument before it starts, because the data is geographically specific and reproducible.
Grid-based tracking turns a vague ranking claim into evidence a client can actually verify against their own experience in different parts of town, which is exactly what justifies a recurring retainer instead of a one-off project fee. If you’re still running single-keyword checks for local clients, pilot a grid audit on one or two accounts this month and track the AMR shift. The conversation upgrade alone is usually worth the switch, and tools built specifically for agency reporting make the transition far less painful than building spreadsheets by hand.
— Local
Running Grid Audits Without the Reporting Headache
There are tools built for exactly the workflow above: customizable scan grids, white-label reports on your own domain, and no requirement to connect a client’s Google account to run a scan. That last point matters more than it sounds. Chasing down GBP login access for every client is one of the quieter time drains in local SEO work, and skipping the profile connection entirely removes a whole category of onboarding friction.
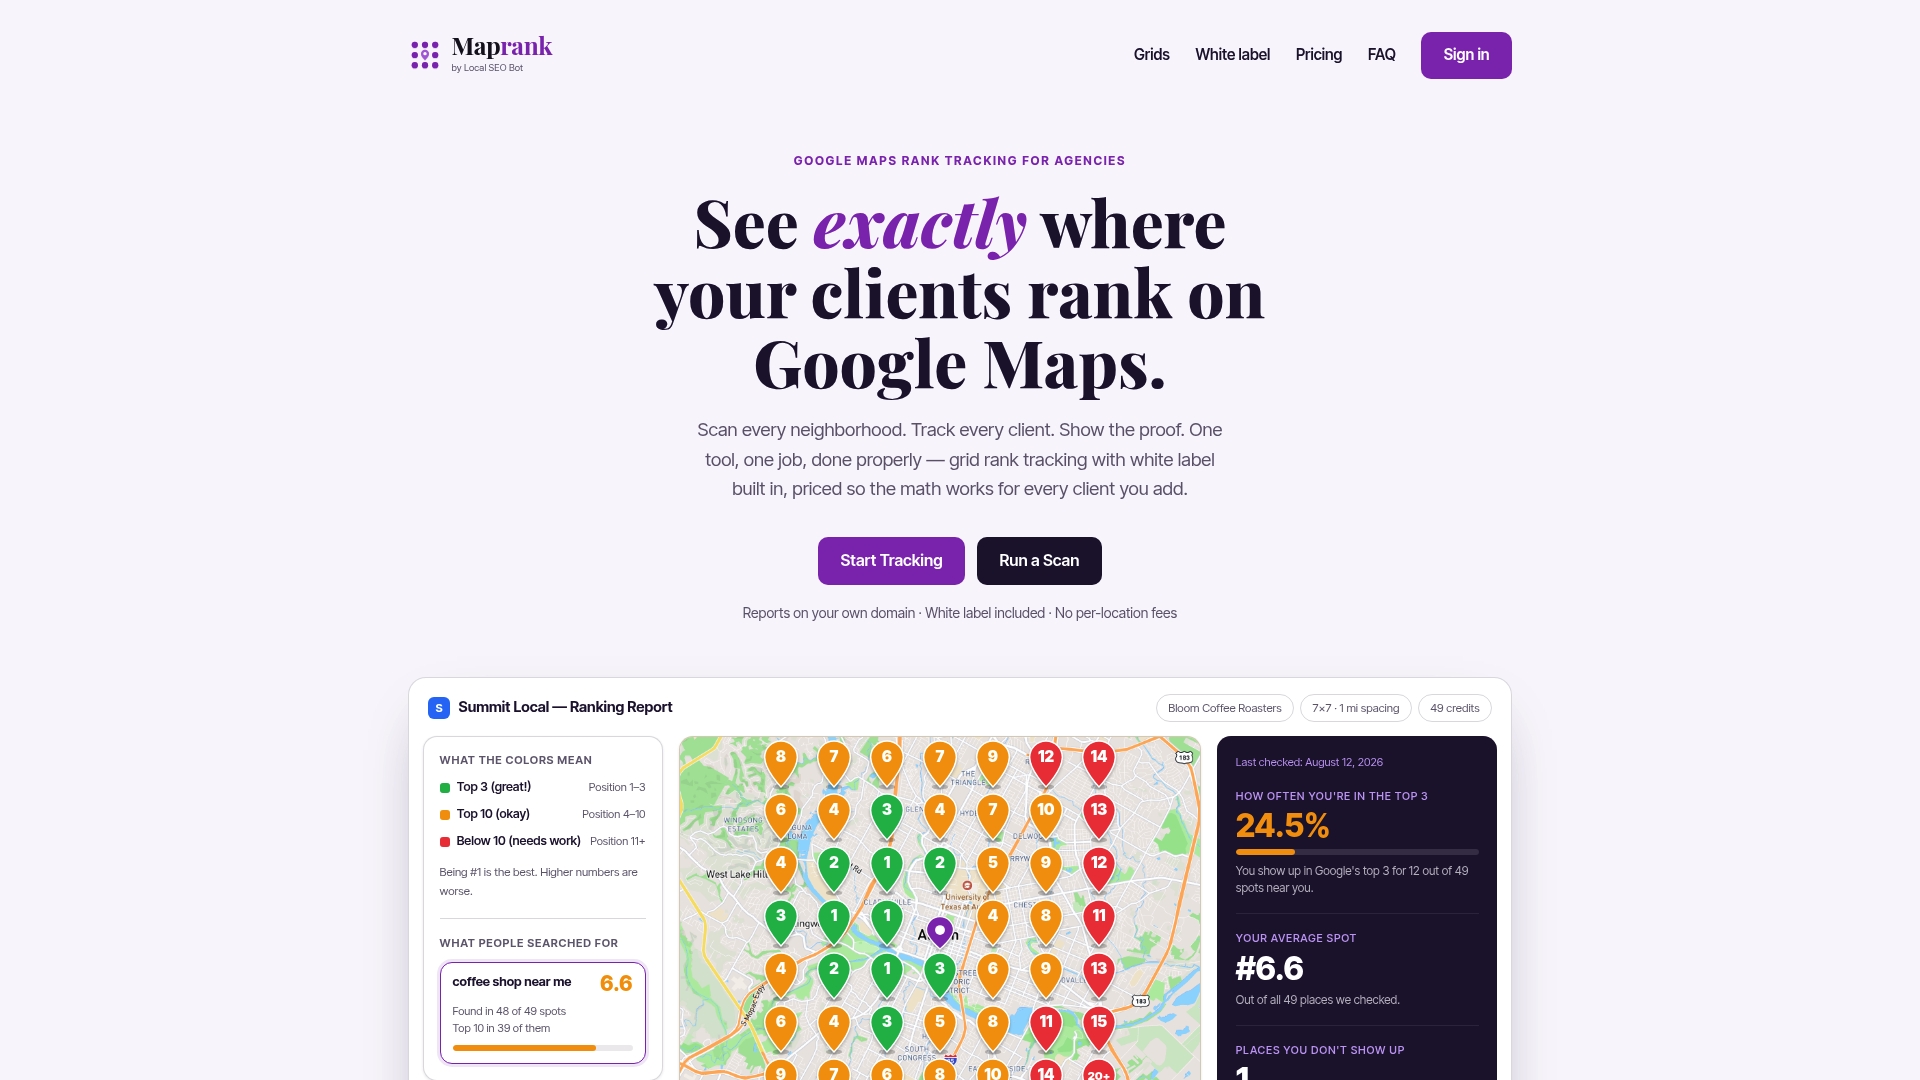
Every plan includes unlimited businesses, so you’re not paying a per-location surcharge as your client roster grows, and credit-based pricing stays transparent instead of the tiered, add-on-heavy structures common among broader white-label local SEO suites that treat grid tracking as one feature among many rather than the core product.
Run a trial grid on one or two accounts, export a branded report, and set a 60-day AMR target before your next client call. See the full feature set and start your first scan.
Sources
- How to Report Local Ranking Performance to Clients - Keyword Rank Tracking
- Google Maps Ranking Report for Agencies (2026) | Lead Oracle AI Blog