Grid Spacing Settings for Google Maps Rank Tracking
Grid Spacing Settings for Google Maps Rank Tracking

Grid spacing is the distance between neighboring scan points, and it decides what a Google Maps rank scan can see. Set it tight (0.2 to 0.5 miles) for businesses customers visit, such as dentists and restaurants. Go wider (1 mile or more) for citywide or regional coverage. Then size the grid so its outer ring reaches past the point where rankings fall off, and not only to the edge of the service area.
This guide shows how to pick spacing, grid size and overlap, how to plan a citywide scan without wasting scans, and how to read the result honestly.
TL;DR
- Coverage equals spacing times the number of gaps. A 7x7 grid at 0.5-mile spacing covers a 3-mile span edge to edge, so 1.5 miles in each direction from the center.
- Match spacing to how the customer behaves: tight for walk-in and short-trip businesses, wider for service-area businesses and metro-level views.
- Extend the grid until you see rankings drop off. A scan that is all green pins is usually too small to tell you anything.
- For a big city, run a coarse citywide scan first, then add tighter scans over the weak zones.
- A grid is a sample of points, not a measurement of every street. Read patterns, not single pins.
Table of Contents
- What grid spacing means in Google Maps rank tracking
- Why spacing changes what you see
- How to choose spacing by business type
- Service-area businesses need a different center and radius
- Planning grid overlap and continuous coverage
- Citywide coverage without a sparse or bloated grid
- Other settings that shape the result
- How to read a grid honestly
- Perspective: why we built spacing to be yours to set
- Run your first scan with the spacing you planned
- FAQ
- Sources
What grid spacing means in Google Maps rank tracking
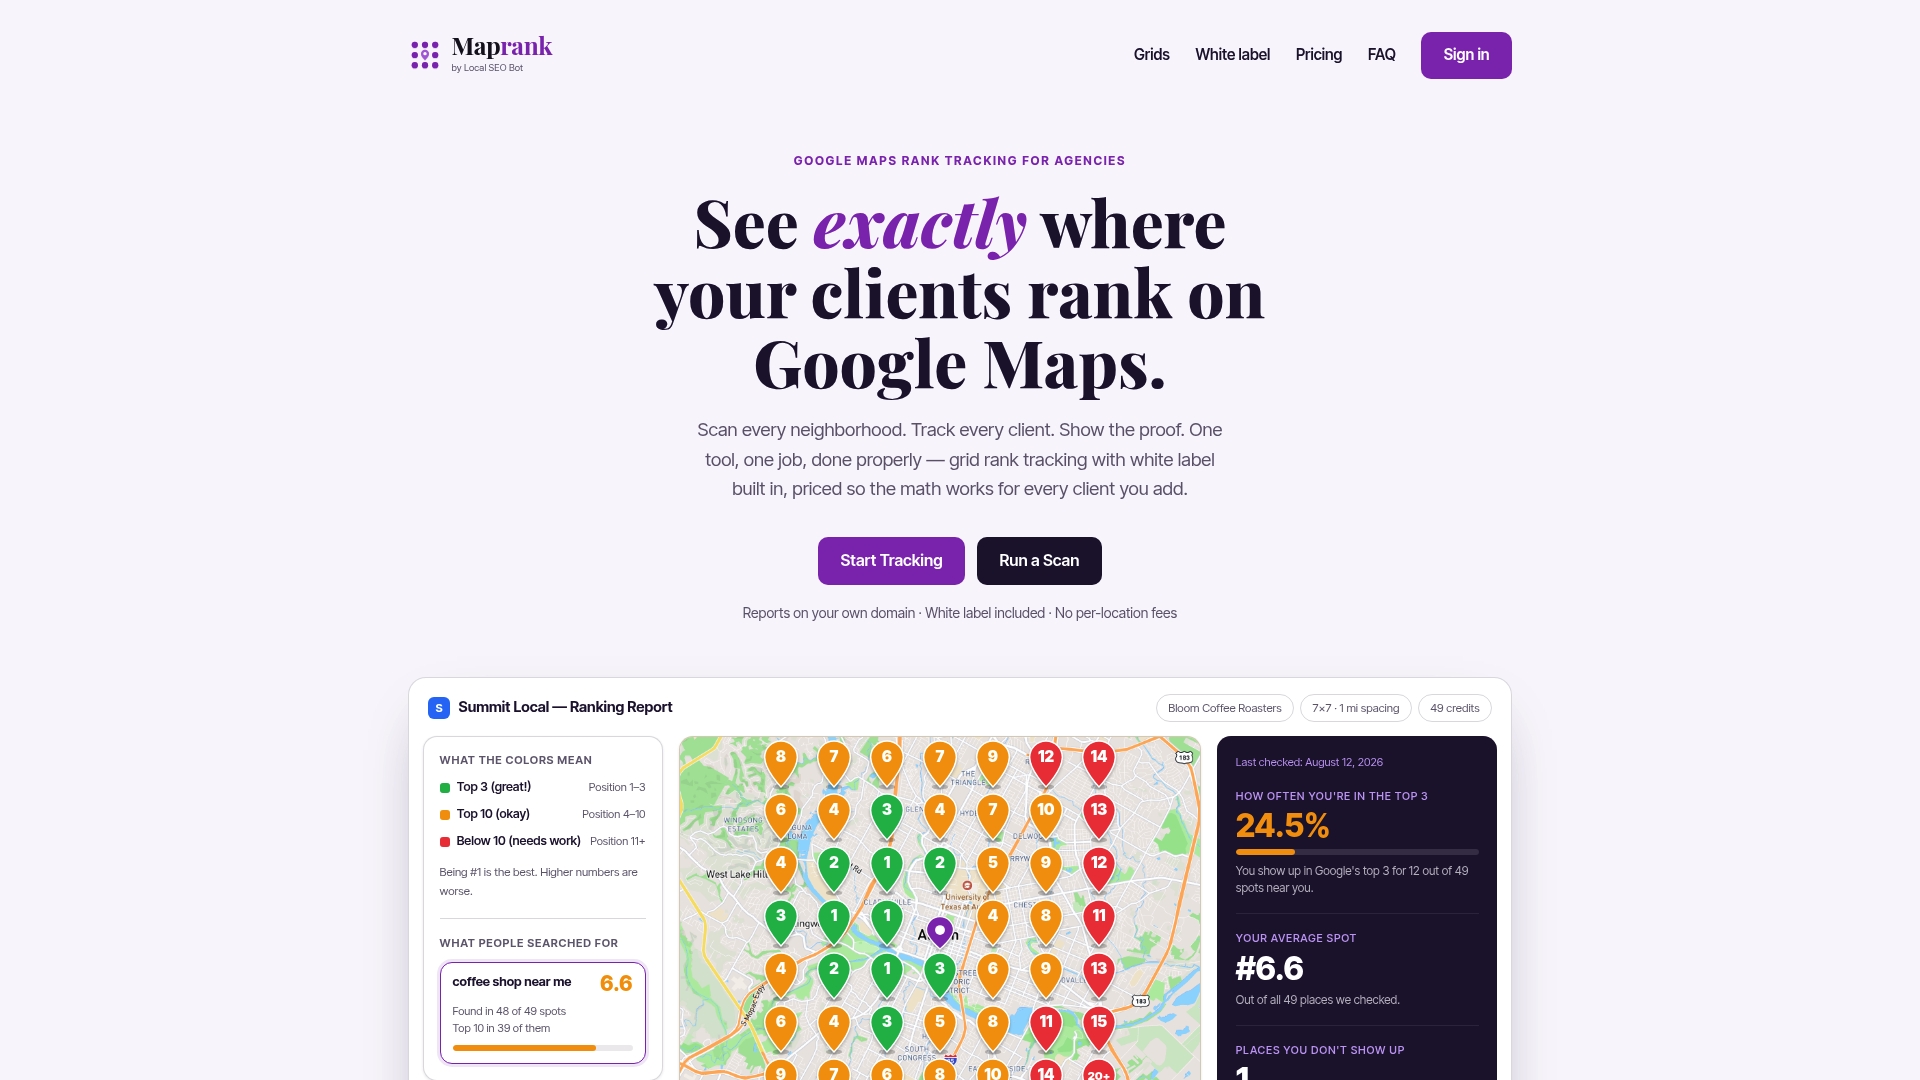
A grid rank scan places a square (or other shape) of points over a map. At each point, the tool runs your search as if the searcher stood there, and records where the business appears. The result is a map of pins, each showing a rank.
Three settings define the scan:
- Spacing: the distance between adjacent points (for example 0.25, 0.5 or 1 mile).
- Grid size: the number of points per side (5x5, 7x7, 9x9 and so on).
- Center point: usually the business address, or the middle of the target area for a service-area business.
Spacing and size work together. The quick formula is:
Coverage width = spacing × (points per side − 1)
| Grid size | Spacing | Points | Edge-to-edge width | Reach from center |
|---|---|---|---|---|
| 5x5 | 0.25 mi | 25 | 1 mi | 0.5 mi |
| 5x5 | 1 mi | 25 | 4 mi | 2 mi |
| 7x7 | 0.5 mi | 49 | 3 mi | 1.5 mi |
| 9x9 | 1 mi | 81 | 8 mi | 4 mi |
| 11x11 | 1 mi | 121 | 10 mi | 5 mi |
The same 25 points can describe a single neighborhood or a small city, depending on spacing. That is why spacing is the most consequential setting on the screen.
Why spacing changes what you see
Google says local results are based mainly on relevance, distance and prominence, and it describes distance as how far the business is from the location used in the search (Google Business Profile Help). Because distance is part of the calculation, the same business can rank first on one block and fall off the pack a mile away.
A 2021 study by Rankings.io of personal injury lawyer listings used 225 locations on a 15x15 grid. It found that average ranking dropped by about 8 positions within the first mile from the business (Rankings.io proximity study). The study also noted that results beyond position 20 were logged as “20+”, so its averages needed imputation. Treat it as an illustration of how steeply visibility can fall with distance for one competitive category, not as a rule for your market.
The practical consequences for spacing:
- Too wide: you can step right over the pocket where a business is strong, or the pocket where a competitor takes over. A 2-mile spacing in a dense downtown shows you four or five pins for an area where the rank can change on every block.
- Too tight: neighboring pins mostly repeat each other, and you spend scan credits confirming what you already know. A 0.1-mile spacing across a whole metro is a very expensive way to draw the same color.
- Just right: neighboring pins differ often enough to reveal edges (where the rank moves from 1-3 to 4-10 to 20+), but not so often that every pin is noise.
How to choose spacing by business type
Start with the question: how far will a customer realistically travel, or how far does the business actually serve? Then pick a spacing that gives you at least 4 or 5 pins across that distance.
| Business type | Typical reach | Starting grid |
|---|---|---|
| Restaurant, cafe, salon, dentist in a dense area | Under 1 mile | 5x5 at 0.2 to 0.25 mi |
| Retail, gym, clinic in a suburb | 1 to 3 miles | 7x7 at 0.5 mi |
| Plumber, HVAC, electrician, locksmith | City radius, 5 to 10 miles | 9x9 at 1 mi |
| Multi-location or regional service business | Metro area | 11x11 at 1 to 2 mi |
| Rural business | 10+ miles | 7x7 or 9x9 at 2 to 3 mi |
These are starting points that reflect how the grid math works, not fixed rules. Adjust after your first scan.
Dense urban areas
In a city center, businesses sit within a few blocks of each other, and the rank can change quickly. Use tight spacing (0.1 to 0.25 miles) with a small grid. The aim is to see the neighborhood-level fight for the top three.
Suburbs and mid-size towns
Distances are longer and competitors are more spread out. A 0.5-mile spacing with a 7x7 or 9x9 grid usually shows a clean gradient from the strong center to the weak edges.
Rural markets
Customers drive farther, so a 0.5-mile grid would show one big blob of color. Use 2 to 3 miles and accept that each pin represents a large area.
Service-area businesses need a different center and radius
A storefront has an address that anchors its ranking. A service-area business (SAB) often hides its address, and its ranking behavior around that base can differ. One analysis explains that storefronts and SABs go through the same underlying local algorithm but supply location data differently: a storefront uses a public address, while an SAB uses an internal operating base plus a declared list of service areas (Vega SEO Talks).
Google Business Profile does not let an SAB set a radius. It lists cities, postal codes or other areas, and one guide advises keeping them within roughly two hours of driving from the base (WP Consults). For scan planning, that means:
- Center the grid on the business base, then check whether the grid reaches the farthest area the client actually serves.
- If the client serves two or three distinct towns, run one grid per town or one wide grid, rather than one dense grid on the base.
- Report results against the declared service areas, not just distance rings.
Planning grid overlap and continuous coverage
Grid points do not literally overlap, because each is a single coordinate. What overlaps is the area each pin stands for. With a 1-mile spacing, each pin speaks for roughly a 1-mile square around it. If you run a second scan next to the first, the edges can overlap or leave gaps. Plan for that deliberately.
Rule 1: share a ring, not a block
When you tile several scans across a city, set the second grid’s center so its outer ring lands on the same line as the first grid’s outer ring. The formula: the distance between the two centers should equal the coverage width (spacing × gaps). Then the edge points coincide, and you can compare them directly to confirm both scans agree.
Rule 2: keep the same spacing across tiles
Colors only compare fairly when pins mean the same size of area. Mixing a 0.25-mile and a 1-mile grid in one report makes the second look blotchy and the first look precise, and neither tells the full story. Keep spacing identical within a map, and change it only between maps.
Rule 3: go past the edge of the problem
Set the grid radius far enough out to see where rankings drop off, rather than a field of all-green pins (Local Search Forum). A scan that never leaves the top three tells you the grid was too small, not that the business dominates. Add one ring or widen the spacing until the outer pins show lower ranks.
Rule 4: use the same keyword and settings for comparison
To see change over time, repeat the same keyword, center, spacing and size. If you change any of them, you are comparing two different experiments.
Citywide coverage without a sparse or bloated grid
The goal of a citywide scan is to answer: where in this city does the client show up, and where does a competitor win? Two-stage planning is efficient.
Stage 1: coarse sweep. Cover the whole city with a wide spacing, such as 9x9 at 1 mile, or 11x11 at 1 to 2 miles for a larger metro. This costs few pins per square mile and finds the broad pattern: strong core, weak north side, dead zone across the river.
Stage 2: zoom on the weak spots. Pick the one or two areas that matter commercially (high-income neighborhoods, a growing suburb, the area the client wants to win) and scan them at 0.25 to 0.5 mile. This shows exactly which streets flip from rank 3 to rank 12.
Stage 3: monitor on a schedule. Re-run the same settings monthly, or after major profile changes, so the trend lines up.
A worked example: a plumber in a mid-size city serves roughly an 8-mile-wide area. A 9x9 grid at 1-mile spacing covers exactly 8 miles edge to edge with 81 pins. Run it once to find the shape. If the plumber is weak in the eastern suburbs, add a 5x5 at 0.5 mile (a 2-mile square) centered there, 25 pins, to see why.

Compare that with a single 21x21 grid at 0.4-mile spacing for the whole city: 441 pins, mostly repeating each other where nothing changes. Two-stage planning gets better detail where it matters for a fraction of the scans.
For more on tracking across a full area, see our guide to a local SEO grid tracker and the Google Maps grid rank tracker overview.
Other settings that shape the result
Spacing is the headline, but the pins also depend on:
- Keyword: “emergency plumber” and “plumber near me” produce different maps. Scan the terms customers use, one at a time.
- Point count and cost: more points mean more credits per scan. Decide how many scans a month a client’s plan allows before choosing 121-pin grids by default.
- Shape and center: a square grid wastes pins over water, parks or a neighboring county. If the tool allows custom shapes or a shifted center, use them.
- Device and language settings: keep them identical between scans.
Our walkthrough on how to track Google Maps rankings covers the full setup sequence.
How to read a grid honestly
A grid is a sample, not a census. Each pin is one simulated search from one coordinate at one moment. Some cautions that help you report it well:
- Rank can differ from what a real person sees, since real results are personalized by history and device. Use the grid to compare areas and track change, not to promise a specific position.
- Look at clusters, not single pins. One red pin surrounded by green is probably noise. A band of red across a whole neighborhood is a finding.
- Beware the “20+” bucket. Many tools stop counting after a certain position, so averages hide how far down a business really sits. The Rankings.io study flagged this same limit in its own data.
- Averages hide shape. Two businesses can share an average rank of 6 while one is dominant at home and invisible elsewhere. Show the map, not just the number.
- Keep a baseline. The first scan matters most. Save it, then compare later scans against it with identical settings.
Perspective: why we built spacing to be yours to set
We built Maprank around a simple belief: the agency, not the tool, knows how a client’s customers move. A dentist on a walkable street and a roofer serving three counties should never share the same default grid.
That is why grid size and spacing are fully customizable, and why scanning needs no Google account connection from the client. You pick the area, you pick the distance between points, and the scan runs.
Pricing follows the same logic. You pay for scan credits, not for each location you add, so planning a coarse citywide sweep and a tight neighborhood follow-up costs what the scans cost, and nothing for the number of businesses you track. Every plan includes unlimited businesses and white label reporting on your own domain, so the clearer map ends up in front of your client under your brand.
Local
Run your first scan with the spacing you planned
If you manage local SEO for clients, Maprank lets you set custom grid size and spacing, scan without Google account integrations, and send white label reports from your own domain. Plans start with Solo at $19 per month ($228 per year), Agency at $39 per month ($468 per year), Pro at $79 per month ($948 per year) and Scale at $149 per month ($1788 per year), all with unlimited businesses. See the plans and pick the one that fits your scan volume.
Want to check one location before committing to a subscription? Try the one-off Google Maps rank check. You can also read our Google Maps rank tracker guide for how scans fit into client reporting.
FAQ
What is the best grid spacing for a local business?
It depends on how far customers travel. For dense, walk-in businesses, 0.2 to 0.25 miles works well. For most suburban businesses, 0.5 miles is a sound start, and for service-area businesses covering a city, 1 mile is common. Run one scan, then tighten or widen until neighboring pins differ enough to show edges.
How big should the grid be?
Big enough that the outer ring shows rankings dropping off. Multiply spacing by the number of points per side minus one to get the total width, and compare it to the area the client serves. If every pin is in the top three, enlarge the grid or widen the spacing.
Should scans overlap?
Points are single coordinates, so they do not overlap, but adjacent scans should share an edge ring. Place the next grid’s center one coverage width away from the first and keep spacing identical. That gives you continuous coverage and lets you check that both scans agree on the shared edge.
How many scan points do I need for a whole city?
Most cities are covered well by 49 to 121 points in a first coarse scan, such as 9x9 at 1 mile for an 8-mile-wide area. Then add smaller, tighter scans (25 to 49 points) only over the zones that matter. This beats one large dense grid in both detail and cost.
Can a grid scan guarantee what customers see?
No. A scan is a simulated search from set coordinates, and real results can vary by user and device. Use it to compare areas, spot weak zones and track change over time with consistent settings.
Sources
- Google Business Profile Help: improve your local ranking
- Rankings.io: Google Maps proximity and rankings study
- Vega SEO Talks: service area vs storefront proximity
- WP Consults: local SEO for service area businesses
- Local Search Forum: setting up search grid reports
Recommended
- Google Maps Grid Rank Tracker: See Your Rankings Across Every Part of Your Service Area
- Geo Grid Rank Tracker: Visualize Your Local Rankings on a Map Grid
- Deck Builder Rankings on Google Maps: Proximity, Seasonality and What Your Grid Is Telling You
- Real-Time Google Maps Rank Tracker: Check Your Position Right Now