Multi-Keyword Geogrid Tracking: How to Scan Several Terms
Multi-Keyword Geogrid Tracking: How to Scan Several Terms

A multi-keyword geogrid runs the same grid of map points for several search terms, so you see where a business shows up in Google Maps for each service, not just one. Rotating keywords across scans is how you cover a whole keyword set without burning your scan budget on every term at every point, every time.
This guide explains how the setup works, how to decide what to scan together and what to rotate, how to read the maps, and why a grid result can differ from what one person sees on their phone.
TL;DR
- A geogrid places points over a service area and runs a simulated search from each one. A multi-keyword setup repeats that for every term you care about.
- Rotating keywords means scanning a core set often and the long tail on a slower cycle. It keeps trends visible while controlling cost.
- Read each map for coverage (how many points show the business in the top results), not only for an average rank.
- Compare keyword maps side by side. The gaps between them show which services Google trusts the business for, and where.
- Keep grid size, spacing and keyword wording constant between scans so changes mean something.
Table of Contents
- What a multi-keyword geogrid is
- Why rank by location at all
- How keyword rotation scans work
- What keyword rotation maps show
- How to configure a campaign
- Why grid results can differ from what you see on your phone
- Turning multi-keyword reports into action
- Our perspective
- Run your rotation with Maprank
- FAQ
- Sources
What a multi-keyword geogrid is
A geogrid overlays a grid of points on a map. Each point acts as the origin of a simulated local search, which shows how a business ranks for a keyword at that exact spot. Put a 7x7 grid over a city and you get 49 small searches, each answering one question: if someone stood here and typed this phrase, where would this business appear?
A single-keyword scan answers that for one phrase. Local businesses rarely live on one phrase. A plumber is searched as “plumber,” “emergency plumber,” “water heater repair,” “drain cleaning” and more. Each term can produce a different picture, because the businesses Google considers relevant change with the wording. A multi-keyword geogrid is simply a set of those scans on the same grid, kept together so you can compare them.
The value is in the comparison. One map tells you where a business is strong. Four maps tell you which service is strong where, and which neighborhood is invisible for which term.
Why rank by location at all
Local results depend heavily on where the searcher is. Google has said local results are based mainly on relevance, distance and prominence, and search guides on the local pack note that the exact weighting is known only to Google. Distance is the factor a single “city-wide” rank check hides. A business can be first near its own address and absent two miles away.
That is also why one number such as “ranks #3” misleads. Searchers a few miles apart in the same city often see different results, so a rank is only meaningful when you state the point it was measured from. The grid makes that explicit.
How keyword rotation scans work
Every scan consumes something: credits, API calls or time. Multiply points by keywords by frequency and the numbers climb quickly. A 7x7 grid is 49 points. Ten keywords is 490 point-checks per round. Run that weekly for twenty clients and you have a budgeting problem.
Rotation solves it by splitting keywords into tiers and giving each tier its own rhythm.
| Tier | What goes in it | Example for a dental clinic | Suggested rhythm |
|---|---|---|---|
| Core | The two or three terms that drive most calls and bookings | dentist, emergency dentist | Every scan cycle |
| Service | Specific high-value services | teeth whitening, dental implants | Every other cycle |
| Long tail | Modifiers, secondary services, seasonal terms | invisalign near me, pediatric dentist | Rotated in, one or two per cycle |
The rhythm is a starting point, not a rule. What matters is that the core set is measured consistently, because that is the trend line you report. The rotating terms are your discovery layer: each cycle you look at a different slice, and over a month or two you have covered the full set.
Why not scan everything at once?
Sometimes you should. A new client’s first audit is a good moment to scan every priority keyword on one grid, so you start with a complete baseline. After that, scanning everything on every cycle mostly produces more maps that look the same. Rotation keeps the budget for what changes: the core terms, plus whichever long-tail keyword you are currently working on.
Keep the variables fixed
Rotation only works if each keyword is comparable with its own past. For each keyword, hold these constant:
- The exact phrase, including word order and plurals.
- Grid size and point spacing.
- The center point.
- The business or listing being tracked.
Change any of them and a jump on the map may be an artifact of your setup, not a real ranking shift. If you must change the grid, start a new baseline and note the date in your report.
What keyword rotation maps show
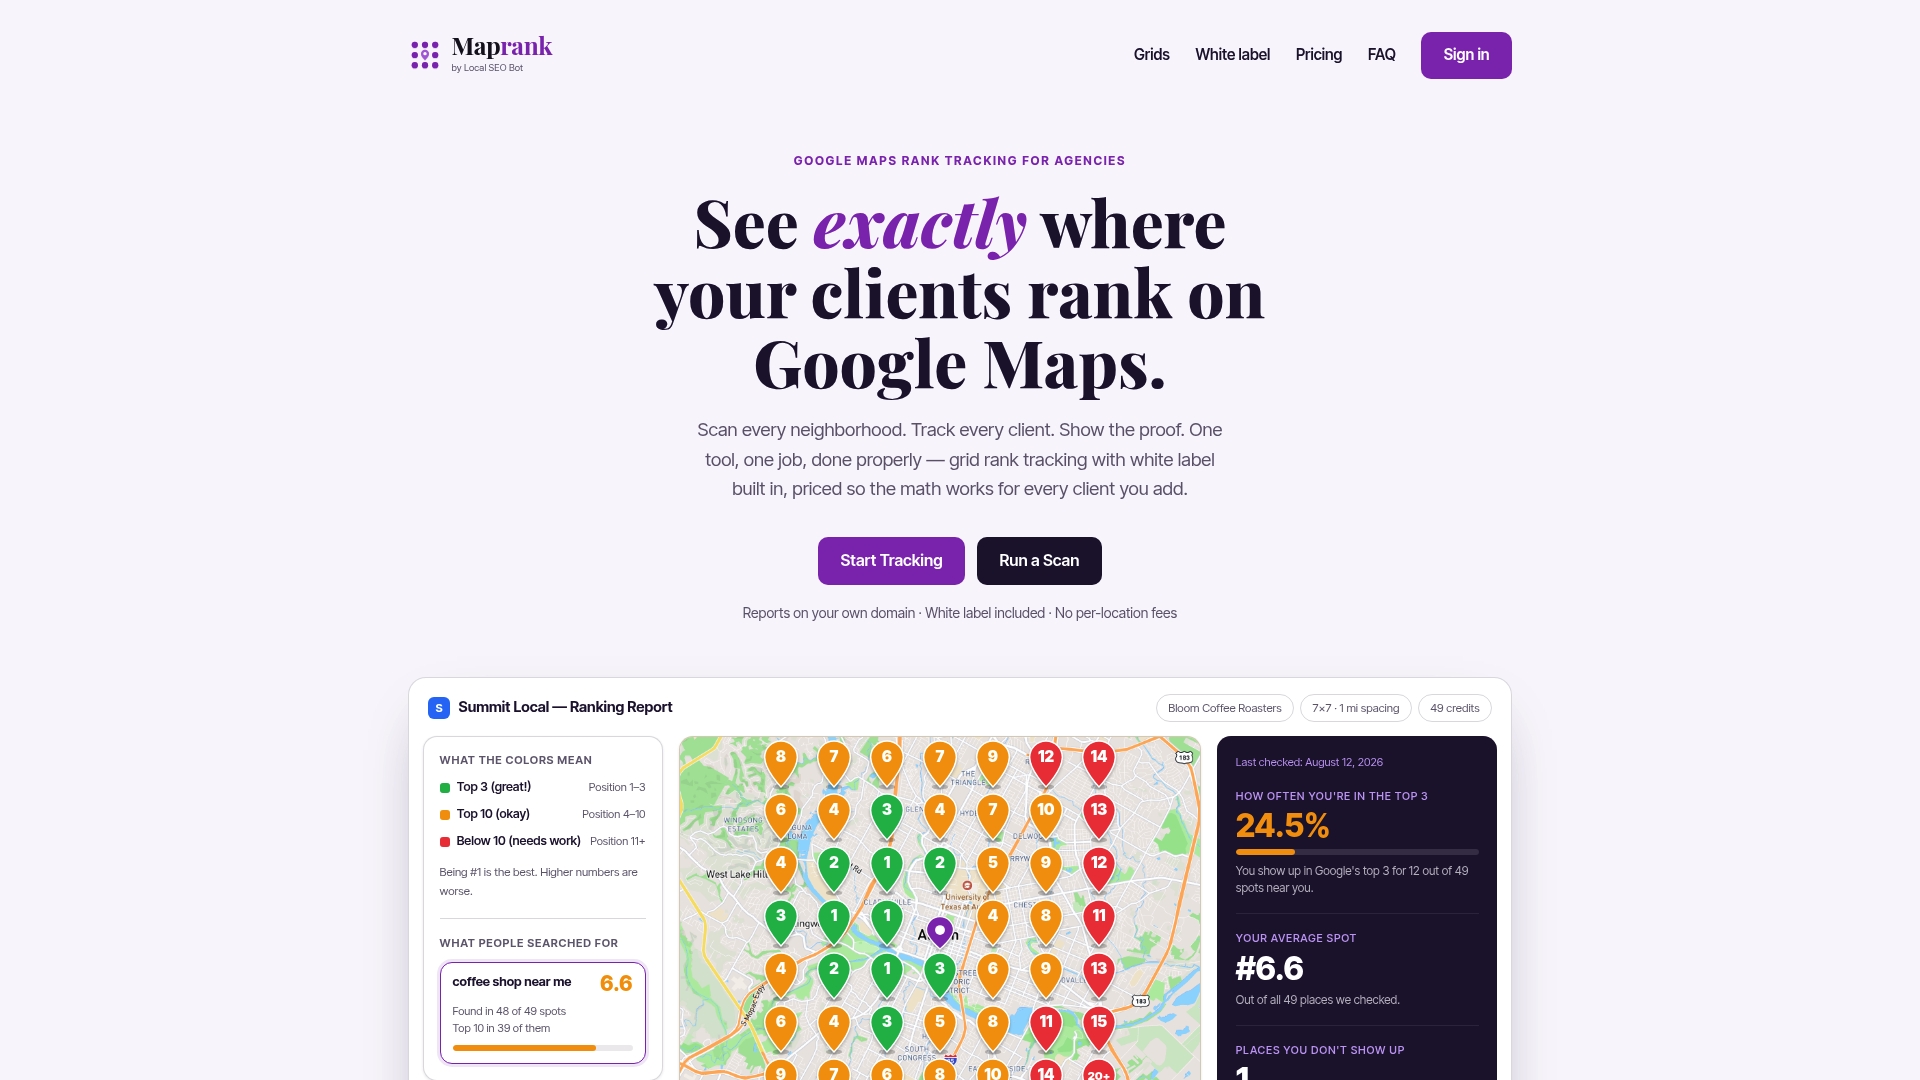
A rotation map is a keyword’s grid result, usually color coded by rank: green for top positions, amber for the middle, red for low or absent. Laid next to each other across the rotation, the maps show three things.
Footprint. How many points are green? A business might be green at 30 of 49 points for its core term and 6 of 49 for a service it also offers. That second number is the opportunity.
Shape. Does visibility fan out evenly or cluster around the address? A tight cluster around the pin suggests the business wins mostly on proximity. A lopsided shape, strong in one direction, often means a competitor owns the other side, or that the area has fewer relevant listings.
Edges. The outer ring tells you how far the business reaches. If the ring is red on every keyword, the service area on paper is larger than the real one.
Interpreting visibility across points
A practical way to read a map without over-reading it:
- Count points in the top three. This is the closest proxy for showing in the map pack.
- Note the weakest quadrant and check what is there: a competitor cluster, a neighborhood across a river or highway, or nothing at all.
- Compare with the same keyword last cycle. Look for movement in a block of neighboring points, not a single cell. One point flipping is noise. A whole corner turning green is a change.
- Compare with the other keywords. If “emergency” terms are strong but the plain category term is weak, the profile’s category, services and content may favor one angle.
How to configure a campaign
Choose keywords from customer language
Start with how customers describe the problem, not how the business names its services. Pull terms from the Google Business Profile’s own categories and services, from call logs, and from the autocomplete suggestions Google shows. Aim for six to twelve keywords per location, sorted into the tiers above.
Set the scan area
Center the grid on the business address unless the business serves customers elsewhere. Then size it to the real service area. A restaurant that draws from a mile or two needs a tight grid. A roofer who drives 25 miles needs a wide one. Too small and you miss the edge where the business drops off. Too large and you spend credits on points the business will never serve.

Pick spacing
Smaller spacing gives finer detail inside a neighborhood but covers less ground for the same grid. As a rule of thumb, dense urban areas call for tighter spacing, because results change over short distances. Rural areas can use wide spacing. Custom grid sizes and spacing are useful here, since a fixed preset rarely matches a real service area.
Set the schedule
Weekly or every two weeks suits core keywords for most clients. Monthly is enough for the long tail and for businesses in slow-moving markets. Match the schedule to your reporting cadence: if the client gets a monthly report, you want at least a few data points inside the month.
Why grid results can differ from what you see on your phone
Expect some differences, and tell clients up front.
- Personalization. Google personalizes results, so a searcher’s history and exact position can change what they see.
- Exact location. A grid point is a coordinate. A person standing half a block away may get a slightly different list.
- Timing. Map results shift through the day and week, as hours, reviews and competitors change.
- Device and intent. Mobile searches and “near me” phrasing can produce a different set than a desktop search for the same words.
- Wording. “Plumber” and “plumbers” are not guaranteed to return the same list. This is why rotation tracks exact phrases.
The grid is best used as a consistent measuring instrument, not a promise of what each person sees. Its strength is trend and pattern: the same method, repeated, from the same points.
Turning multi-keyword reports into action
A map is only useful if it leads to work. Here is how agencies typically move from maps to tasks.
Find the gap. Lay the maps for all keywords side by side. Pick the service with real demand and a thin footprint.
Diagnose it. Check that the service is listed on the profile, that the category fits, that a page on the website covers it, and that reviews mention it. Then look at who is green in the weak area.
Act, then wait. Make one or two changes, such as adding the service, updating a page or earning reviews that mention it. Then let two or three scan cycles pass before judging.
Report the change. Show the before and after map for the same keyword and grid. Clients grasp a block of red turning green faster than a rank table. For multi-location clients, keep each location’s grid in one place, as covered in our guide to rank tracking for multi-location businesses.
If you are new to the format, our explainer on what a geo grid rank tracker is covers the basics, and the piece on local SEO grid trackers goes deeper on service-area mapping.
Our perspective
We built Maprank around a simple observation: the more keywords and clients an agency tracks, the more most pricing models punish it. Per-location fees and tangled add-ons make agencies think twice before adding a keyword, a neighborhood or a new client. That is the opposite of what good local SEO needs.
Multi-keyword work is where grids earn their keep, so we price by scan credits. Every plan includes unlimited businesses and white label reporting on your own domain, and you decide how to spend credits: a dense grid on one core term, or a wider rotation across many. You can change grid size and spacing to fit the real service area.
We also do not ask for Google account connections. You can start tracking a client without waiting for access to their profile, which matters when you are pitching and want a baseline before the contract is signed.
Our aim is that the person running the scans is thinking about what the map says, not about what the next scan will cost.
Local
Run your rotation with Maprank
Maprank is a grid-based Google Maps rank tracker built for agencies, consultants and freelancers. Credits pay for scans, grids are customizable, and white label reports go out on your own domain. All plans include unlimited businesses.
Published plans, billed monthly: Solo at $19, Agency at $39, Pro at $79 and Scale at $149. Annual billing is $228, $468, $948 and $1,788 respectively. Credits, seats and grid size scale by plan, so pick the tier that matches your scan volume. See the plans on Maprank or run a one-off Google Maps rank check first. For a view of how grid tools stack up by type, see our ranking of local rank trackers.
FAQ
How many keywords should I track per location?
Six to twelve is a workable range for most local businesses. Put two or three revenue-driving terms in your core set and rotate the rest. More keywords add reporting noise unless each one maps to a service the client wants to grow.
How often should I rotate keywords?
Scan the core set every cycle and rotate secondary terms so each gets measured every month or two. If you are actively working on a service, move its keyword into the core set until the work settles. The key is keeping each keyword’s grid and wording unchanged between scans.
What grid size should I use?
Match it to the real service area. Small grids suit businesses that draw from a few blocks or miles, and larger grids suit service-area businesses that travel. A 7x7 grid is a common starting point for a city-wide view, but test it against where the client’s customers actually live.
Why does my map show a rank that differs from my own search?
Grid points are exact coordinates, while your own search reflects your device, history and position. Results also shift over time. Use the grid for patterns and trends across many points, not to settle a single disputed ranking.
Can I use a geogrid without access to the client’s Google account?
Yes, with a tool that scans public results. Maprank does not require Google account connections, so you can run a baseline before you have profile access.
Sources
- Geogrid: Map Your Local Search Rankings Geographically
- What is the Google Local Pack? How to rank in the 3-pack
- 5 Ways Google Personalizes Search Results (and How It Affects Rank Tracking)
Recommended
- Geo-Grid Tracking for a Siding Contractor Site: Where to Scan and What to Watch
- Tracking a Hardscape Site Across a Suburban Metro: A Geo-Grid Playbook
- Tracking a Kitchen Remodeling Site in a Competitive Metro: Grids, Keywords and Honest Benchmarks
- Local SEO Grid Tracker: Map Your Rankings Across Your Entire Service Area