Stop Reporting Averages: Agency Rank Tracking With 25–49 Grid Points
Stop Reporting Averages: Agency Rank Tracking With 25–49 Grid Points
Agency rank tracking is grid-based Google Maps rank tracking: sampling map-pack positions across a lattice of points around a client’s service area instead of trusting one blended number. A single-point rank tells you nothing about the ten neighborhoods where a service-area client is invisible. The fix is straightforward. Run a grid scan, read the heatmap by zone, and hand the client a white-label report that shows exactly where they win and lose.
TL;DR:
- Running a grid scan with 25 or more points reveals location-specific ranking gaps that single-point checks often miss, especially in competitive urban areas.
- Accurate setup involves selecting precise center points, matching grid density to client service areas, and maintaining consistent keyword and grid configurations over time.
- Analyzing heatmaps helps diagnose ranking issues caused by proximity bias, incomplete Google Business Profiles, citation inconsistencies, or review distribution disparities.
- Combining grid data with citation, review, and GBP audits allows for targeted fixes that improve local visibility and justify ongoing SEO investments.
- Weekly scans are recommended for most clients to capture real-time volatility, while higher-density grids are justified for competitive markets despite higher query costs.
Table of Contents
- How does geo-grid rank tracking actually work?
- Agency setup: choosing center, shape, density, and spacing
- Reading the heatmap and running the fix-and-retest loop
- Turning grid data into reports clients actually understand
- What grid scans cost and when higher density pays off
- What are the limitations of geo-grid rank tracking?
- How does rank tracking fit with the rest of your SEO stack?
- Should you track mobile and desktop separately?
- How much does personalization affect rank tracking accuracy?
- How should agencies choose local keywords for grid tracking?
- What does successful geo-grid tracking look like for agencies?
- Why agencies should make grid tracking standard practice
- Run your agency’s rank tracking on Maprank
- Sources
How does geo-grid rank tracking actually work?
A geo-grid scan runs the same keyword from dozens of simulated locations instead of one. Each point on the grid triggers its own localized Google Maps query, and the tool records the local-pack position returned at that exact spot. Stitch those results together and you get a heatmap, not a single number.
Grid sizes are usually described as N×N. A 5×5 grid runs 25 separate searches; a 7×7 grid runs 49. Those two configurations cover most agency use cases, though some tools offer 10×10 or 15×15 tiers for denser urban markets or clients who need finer resolution.
The output is color-coded so a client can read it in ten seconds:
- Top 3 (green): the business shows up in the map pack at that point.
- 4 to 10 (yellow/orange): visible but buried below the fold.
- 11 or lower / not found (red): effectively invisible to a searcher standing there.
- Knowledge Panel overlay: when the query matches the business name closely enough that Google returns a Knowledge Panel instead of the pack, a distinct marker separates that from genuine top-3 ranking.
This is why a single blended “you’re ranked #4 for plumber near me” figure misleads agencies. A client might average out to position 4 across the metro while sitting at position 14 in three of the five zip codes that generate the most calls. The grid is what exposes that gap. The average hides it.
Agency setup: choosing center, shape, density, and spacing
Getting a scan configured wrong produces data that looks precise and means nothing. Work through these decisions in order every time you onboard a new client.
- Pick your center point. Use the business centroid, its exact street address, for a single-location storefront. For a service-area business with no public address (electricians, mobile detailers, home inspectors), center the grid on a polygon or radius that reflects where the client actually wants jobs, not where their office happens to sit.
- Match density to client type. A hyper-local walk-in business (a coffee shop, a nail salon) needs a tight, dense grid. A city-wide service business needs medium spacing. A regional or multi-location brand needs a wider, coarser grid across each market.
- Map keywords to location sets and lock them down. Every keyword should point to a defined grid and center, documented somewhere your team can audit. Left unmanaged, grids drift over time as staff turnover and ad hoc edits quietly invalidate month-over-month comparisons.
- Run your first scan. Start with a 5×5 for a straightforward local client or a 7×7 if the service area spans multiple neighborhoods, then compare the heatmap against what the client already believes about their visibility.
Pro Tip: Screenshot and archive your grid configuration (center, radius, spacing) the day you launch a client. Six months later, when someone asks why rankings “changed,” you need to prove the grid itself never moved.
Reading the heatmap and running the fix-and-retest loop
A heatmap is only useful if you turn the color pattern into a diagnosis. Red cells clustered in one neighborhood usually point to a specific, fixable cause rather than a general ranking problem.
Common root causes behind weak zones include:
- Proximity bias. Google Maps ranking leans heavily on distance from the searcher, so a business three miles outside a cluster of red cells may simply be too far away for organic ranking alone to fix.
- Incomplete or inconsistent Google Business Profile data. Missing categories, sparse photos, or outdated hours drag down performance in contested zones.
- Thin or inconsistent citations. NAP mismatches on directory sites erode trust signals unevenly across a market.
- Lopsided review distribution. A client with 40 reviews clustered around one office location won’t out-rank a competitor with reviews spread across the same neighborhoods showing red.
Once you’ve diagnosed the pattern, prioritize fixes using a simple impact-versus-effort lens: a GBP category fix that touches five red cells beats a review campaign that might move one. After implementing a change, re-scan roughly a week later to check for movement rather than waiting for the next scheduled monthly report.
A grid scan sampling 25 to 49 points per keyword will show far more nuance than a single check ever could, which is exactly the data an agency needs before recommending a location-based marketing push over a straightforward listing fix.
Turning grid data into reports clients actually understand
Raw heatmaps mean little to a client who doesn’t know what a grid is. Translate the scan into metrics they already care about.
Useful client-facing numbers include:
- Neighborhood coverage share — the percentage of grid cells where the client ranks top 3.
- Before/after heatmap comparisons tied to a specific fix you implemented.
- Ranked cell counts by tier (top 3, 4 to 10, not found) tracked month over month.
White-label capabilities matter here because a report that arrives on your letterhead, not a vendor’s, reads as agency work the client is paying for. Branded PDFs, a client-facing subdomain, and scheduled email delivery all reduce the manual work of pulling screenshots every reporting cycle.
Structure the report itself in four parts: context (what changed this period), findings (the heatmap and coverage numbers), recommended actions, and next steps.
A client doesn’t need to understand grid mechanics to feel the difference between “your rankings look fine” and “you own six of the eight zip codes generating your highest-value calls, and here are the two you don’t.”
Cadence should scale with the account. Weekly scans suit most retainer clients; monthly reporting rollups work fine for lower-tier accounts that don’t need granular week-to-week movement.
What grid scans cost and when higher density pays off
Grids cost more than single-point checks because they’re doing more work. A 5×5 grid runs 25 queries per keyword; a 7×7 runs 49. Multiply that across five tracked keywords and a weekly cadence, and query volume adds up fast compared to checking one rank per keyword.
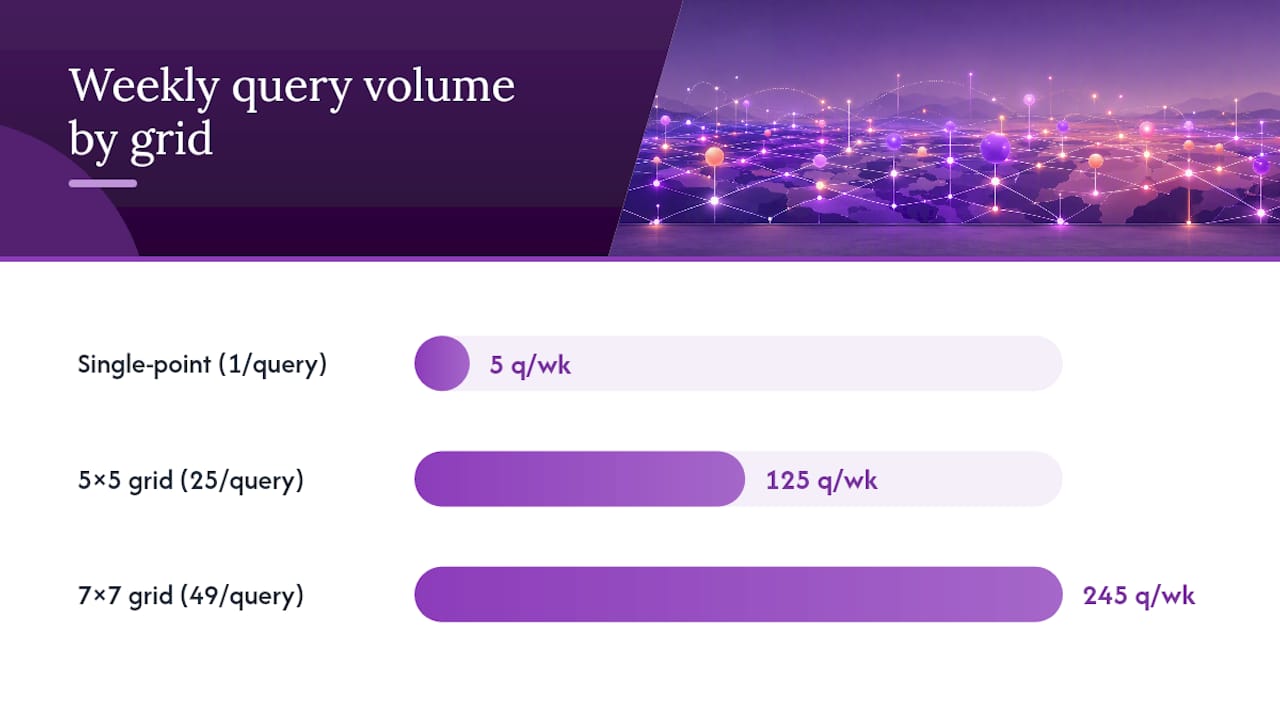
That cost is usually justified. Weekly scanning is the right default for most local clients, since daily scans rarely reveal enough change to justify the extra credits, except during an active campaign push or a Google algorithm update window where you’re actively watching for volatility.
Packaging options agencies commonly use:
- Per-scan credits that scale with grid size and keyword count.
- Bundled monthly scan allotments baked into a retainer tier.
- Tiered cadence add-ons, where a client can upgrade from monthly to weekly scanning for an incremental fee.
Here’s what closing that gap to 70% would mean for call volume. That’s a conversation about revenue, not query counts.
What are the limitations of geo-grid rank tracking?
Grid scans aren’t a perfect mirror of what real searchers see. A few limitations are worth setting expectations around before a client asks why the numbers don’t match their own phone search.
Grids simulate location by spoofing coordinates, which approximates but doesn’t perfectly replicate a real device’s GPS signal, Wi-Fi triangulation, or browsing history. A client checking their own phone at their kitchen table will sometimes see something slightly different from what a grid cell centered nearby reports, because their phone carries personalization signals a simulated query doesn’t.
Grids also age quickly in volatile categories. A market with heavy ad spend or frequent new competitor listings can shift week to week, so a monthly scan in a fast-moving niche risks reporting stale data. Density is a tradeoff, too: a coarse 5×5 grid over a large metro will smooth over real block-by-block variation that a denser 10×10 would catch, which matters more in dense urban cores than in suburban service areas.
Finally, grids show you where you rank, not why. The heatmap flags red zones, but the diagnosis (proximity, GBP quality, citations, review distribution) still requires human judgment layered on top of the data. Treat the grid as the instrument that tells you where to look, not the tool that tells you what to fix.
How does rank tracking fit with the rest of your SEO stack?
Grid data becomes far more useful once it’s connected to the other systems an agency already runs. On its own, a heatmap tells you where a client is weak. Paired with citation data, review monitoring, and Google Business Profile audits, it tells you why.
A practical workflow: pull the grid, flag the red zones, then cross-reference those zip codes against citation consistency and GBP completeness for that specific area. If a client is weak in a neighborhood where a free GBP audit turns up missing categories or thin photo coverage, you’ve found your fix before touching a single backlink.
Many agencies also feed grid coverage numbers into their existing client dashboards or reporting suites, treating the heatmap as one input among several rather than a standalone deliverable. Exporting scan data as CSV lets you layer it against call-tracking numbers or CRM lead sources, which is often the strongest way to prove that a coverage improvement in a specific zip code correlated with a jump in inbound calls from that same area.
The pairing that tends to work best in practice combines a dedicated grid specialist tool for the geographic data with a broader local SEO workflow tool for citations and review management, since few platforms do both equally well.
Should you track mobile and desktop separately?
Yes, and treating them as interchangeable is one of the more common mistakes agencies make with local rank data. Mobile search dominates “near me” style queries, and Google’s local-pack algorithm weighs proximity even more heavily on mobile because it has a live GPS signal to work with. Desktop searches, by contrast, often rely more on the location tied to the searcher’s IP address or account settings, which can be a city center rather than a precise address.
That difference shows up directly in grid results. A client can look strong across a desktop-simulated grid while showing real gaps on a mobile-simulated version of the same keyword set, particularly in denser neighborhoods where several competitors sit close together.
Run your scans configured for the device type where your client’s leads actually convert. A home service business getting most of its calls from someone standing in their driveway with a phone needs mobile-weighted tracking above anything else. A B2B consultancy whose prospects research on a laptop before calling might reasonably prioritize desktop data instead. When budget allows both, scanning each separately and reporting the split gives you a genuinely useful diagnostic instead of one blended number that averages away the difference.
How much does personalization affect rank tracking accuracy?
Personalization is the gap between what a grid scan reports and what an individual searcher sees in the moment, and it’s worth explaining to clients up front so a mismatch doesn’t look like an error. A grid tool runs clean, logged-out, location-spoofed queries. A real searcher brings browsing history, saved places, prior clicks on a competitor’s listing, and sometimes a signed-in Google account that skews results toward businesses they’ve interacted with before.
That’s exactly why grid data is valuable in the first place: it strips personalization out and gives you a repeatable baseline you can compare week to week. If personalization were left in, no two scans would be comparable, because every result would depend on whoever happened to be searching and what their account history looked like.
The practical move is to set client expectations clearly. Explain that the grid shows a neutral baseline, not what any specific customer sees, and that this is precisely why it’s a better tool for tracking progress over time than screenshotting a personal phone search. Localization matters here too. Language settings and regional Google domains can shift results slightly, so keep grid queries configured for the language and country the client’s actual customers search in, not a default setting left over from account setup.
How should agencies choose local keywords for grid tracking?
Keyword selection for grid tracking works differently than it does for organic SERP tracking, because the goal isn’t finding high-volume terms, it’s finding terms that map cleanly to a service and a location a real customer would search from a specific neighborhood.
Start with service-plus-modifier combinations rather than broad category terms. “Emergency plumber [neighborhood]” tells you more about ground-level visibility than a generic “plumber” search that mostly reflects a client’s brand strength downtown. Pull the actual language customers use from call transcripts or GBP search-query reports if the client has access to them, since agency guesses about “how people search” are frequently off.
Keep the keyword list tight and stable rather than sprawling. Tracking 30 loosely related terms across a wide grid multiplies query costs without adding much insight; five to eight well-chosen terms tracked consistently over months give you a far more reliable trend line. Avoid swapping keywords in and out of the grid casually, since every change resets your ability to compare current performance against history.
Finally, match keyword specificity to service specificity. A general contractor probably needs broader terms (“contractor,” “remodeling”) tracked across a wide grid, while a niche provider (a mobile pet groomer, a specific medical specialty) benefits from narrower, more descriptive terms that filter out irrelevant competition entirely.
What does successful geo-grid tracking look like for agencies?
The pattern that shows up across agencies using grid tracking well isn’t dramatic. It’s consistent, small, verifiable wins that compound into a defensible retention story.
A typical example: an agency running a 7×7 grid for a multi-location home services client discovers that two of six service zip codes are showing red across the board, despite the client believing performance was uniform because their blended rank looked fine. The agency traces the gap to inconsistent GBP categories in those specific zip codes, corrects them, and re-scans a week later to confirm the fix moved cells from red to yellow.

That’s the entire playbook. Diagnose with the grid, fix a specific, narrow problem, verify with another scan, then put the before-and-after heatmap directly into the client’s monthly report. Agencies that build this loop into a standard operating procedure tend to have an easier time justifying retainer renewals, because the proof of work is visual and specific rather than a paragraph claiming “rankings improved.”
The common thread isn’t sophistication. It’s that agencies willing to look at the map instead of the average find problems competitors relying on single-point checks never see.
Why agencies should make grid tracking standard practice
Most agencies still treat rank checking as a single number they screenshot once a month. That habit survives because it’s easy, not because it’s accurate. Once you’ve seen a client rank top 3 downtown while sitting invisible six blocks over, going back to a blended average feels like reporting with one eye closed.
The move that changes this fastest is small: run a 30-day pilot with a 5×5 grid on a single client, ideally one where you already suspect the visibility story is more complicated than the client dashboard suggests. Compare the coverage numbers against what the client believed going in. The gap usually speaks for itself.
— Local
Run your agency’s rank tracking on Maprank
Maprank is built for the exact workflow this guide describes: configurable grid scans, white-label reports on your own domain, and no per-location fees eating into your margin as your client roster grows. Every plan includes unlimited trackable businesses, so pricing doesn’t punish you for landing a new account.
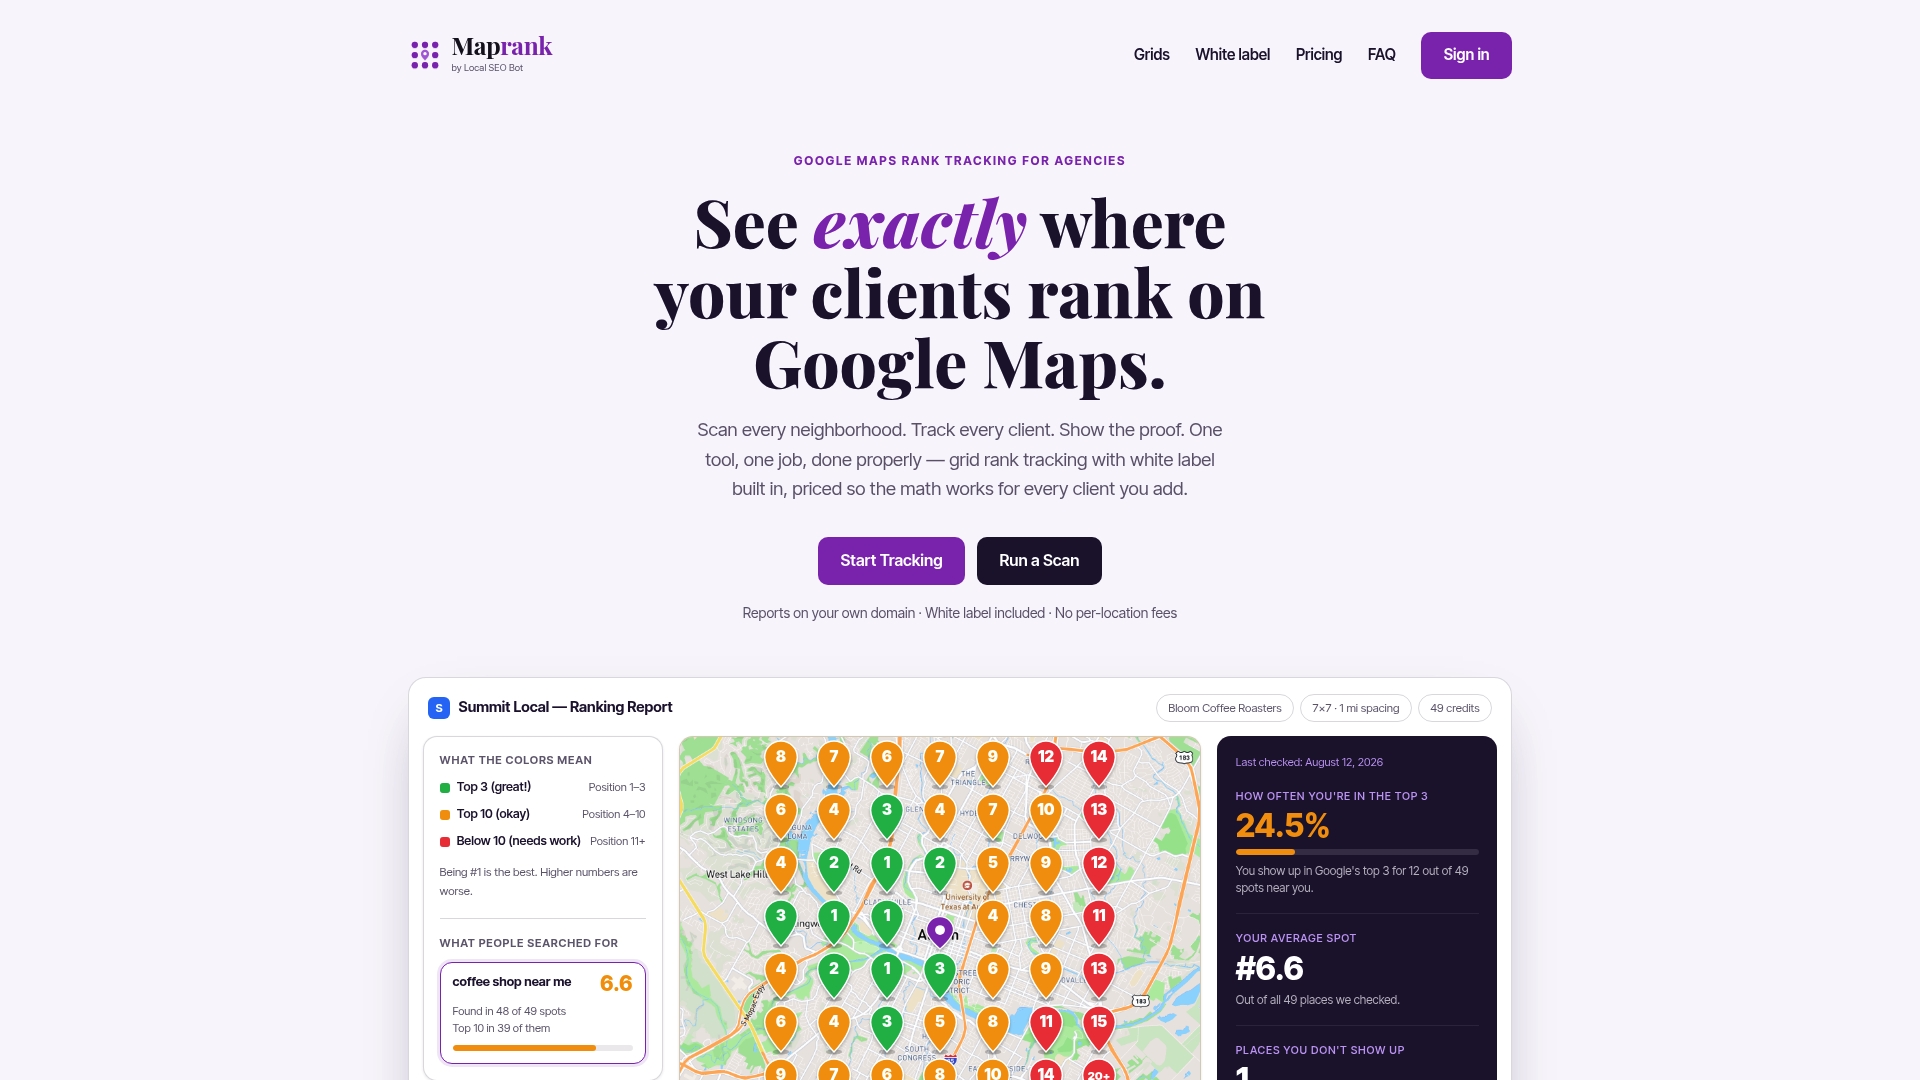
Instead of stitching together screenshots and spreadsheets, agencies running Maprank set a grid, run the scan, and export a branded PDF or scheduled email report the client sees under your name, not a vendor’s. That’s the difference between “here’s a tool we use” and “here’s the report your account manager built for you.” The local rank tracker product page walks through how the grid, white-label, and pricing pieces fit together for agency accounts specifically, and the Google Maps rank tracker page covers the neighborhood-level scan mechanics in more depth. If you’re ready to see what your current clients’ coverage actually looks like, start a scan and compare it against what you’ve been reporting.