Client Retention Reporting for Local SEO Agencies: White Label Proof
Client Retention Reporting for Local SEO Agencies: White Label Proof

Retention reporting pinpoints which clients or cohorts are at risk and turns that signal into prioritized, measurable actions to stop churn. By tracking cohorts, net and gross revenue retention, and repeat behavior, you can see exactly where renewals are weakening before the invoice comes due. The fastest fix is rarely a new feature. It is a focused intervention: a quarterly review, a value report, or a targeted outreach to the accounts the data flags first.
TL;DR:
- Track cohort retention alongside NRR and GRR: NRR includes expansion, while GRR excludes it and reveals whether the existing client base is shrinking.
- Reconcile payments, standardize client IDs, and lock cohort rules and time windows; switching among 30, 60, 90, or 180 days breaks comparisons.
- Rising time to repeat or falling retention in a newer cohort can signal risk while aggregate revenue still looks healthy.
- Quarterly reviews with an executive present are linked to roughly 2.5 times higher renewal likelihood; keep them under 45 minutes and focus on financial outcomes.
Table of Contents
- What client retention reporting measures and why it matters
- Key metrics and KPIs to track in retention reports
- Before you run reports: data and configuration checklist
- How to read and analyze common retention report outputs
- Concrete retention actions driven by report findings
- Using white-label reporting and agency tools to retain clients
- Example report configurations and real-world uses
- Methods for benchmarking client retention against industry standards
- Why reporting should tie to customer economics
- How Maprank supports retention reporting for local SEO agencies
- FAQ
- Sources
What client retention reporting measures and why it matters
Retention reporting tracks how many clients, locations, or accounts stay active and paying over a chosen time window, and how their revenue moves during that period. A solid report covers client counts, repeat visits or purchases, and revenue broken out by cohort, not just a single aggregate number that hides what is actually happening underneath.
Account leads, analytics teams, and operations staff each have a reason to look at this data, though the cadence and audience shift by role. Account leads want a monthly or quarterly view to prep for client conversations. Analytics and ops teams often run weekly checks to catch early drift before it becomes a renewal problem.
The practical payoff shows up in three places:
- Prioritizing account management time toward the clients most likely to churn
- Defending renewals with concrete evidence of progress instead of vague reassurance
- Aligning sales, delivery, and finance teams around the same retention numbers
Without this reporting layer, retention conversations stay anecdotal. With it, they become evidence based.
Key metrics and KPIs to track in retention reports
A handful of metrics do most of the diagnostic work. Retention rate, the share of clients still active at the end of a period, is the starting point, but it only tells part of the story unless you break it into cohorts. Cohort retention curves group clients by their start date and track how each group behaves over time, which exposes whether a specific signup period is underperforming before that shows up in total revenue.
Net revenue retention (NRR) and gross revenue retention (GRR) matter more than headcount once your business depends on expansion and contraction, not just new logos. NRR includes upsells and expansions alongside losses, so it can rise even when client count falls. GRR strips out expansion and measures only what you kept, which makes it the harsher, more honest number when you want to know if the core book of business is shrinking.
Beyond those two, track:
- Repeat rate: the share of clients who return for a second engagement in a defined window
- Time-to-second-purchase: how long it takes a new client to re-engage, and whether that window is stretching
- Expansion and contraction breakdowns: which accounts are growing their spend and which are pulling back
- Customer lifetime value (CLV) and contribution margin: the economic weight behind each retained or lost client
Cohort-level analysis can catch deteriorating client quality before it drags down total revenue, because a weak new cohort can hide behind strong performance from older, established accounts, a pattern documented in customer-based valuation research from the AMA. Tracking CLV alongside retention rate ties the report back to dollars, not just headcount, which is what finance teams actually want to see.
Before you run reports: data and configuration checklist
Reports are only as reliable as the inputs behind them. A few configuration steps prevent the most common reporting errors before they distort a renewal conversation.
- Confirm that all payments are closed and reconciled, since open or pending transactions commonly get excluded from retention counts, a caveat Mindbody’s support documentation flags directly for appointment and order-based reports.
- Verify that client IDs and account-owner fields are populated consistently across your source systems, since duplicate or missing IDs silently undercount retained clients.
- Pick a time window and cohort rule and stick with it: 30, 60, 90, and 180-day windows all answer different questions, and switching between them mid-analysis breaks comparability.
- Set default report columns to include starting cohort size, expansion, contraction, lapsed accounts, and both NRR and GRR, so every stakeholder reads the same shape of data.
- Decide up front how refunds, timezone differences, and partial-month activity get treated, and document that decision somewhere your team can reference later.
Pro Tip: Lock your cohort definition and time window in a shared document before the first report goes out. Changing definitions mid-quarter is the single most common cause of retention numbers that do not match between teams.
How to read and analyze common retention report outputs
A revenue retention waterfall is the most useful single chart in a retention report. It starts with beginning revenue, then shows expansion (upsells, added seats, bigger packages), contraction (downgrades), and churned revenue (lost accounts entirely), landing on an ending figure you can compare period over period. Pabau’s guidance on client revenue retention describes this movement-table approach as a clear way to show exactly what drove the change, rather than leaving stakeholders to guess.
Cohort trend lines complement the waterfall by isolating quality issues in newer client groups before they show up in aggregate numbers. A cohort that is retaining worse than its predecessors is an early warning sign, even if total company revenue still looks healthy because older cohorts are propping it up.
Watch for two behavioral signals that often predict churn before it is visible in the revenue line:
- Rising time-to-repeat, meaning clients are taking longer to re-engage after their last interaction
- Falling repeat rates within a specific cohort or account-owner book, even if overall repeat rate looks stable
Once you spot a risk signal, score accounts by two factors: dollars at risk and engagement signals like declining usage or missed check-ins. A simple scoring table helps prioritize where to spend limited account-management time:
| Signal | What it flags | Typical response |
|---|---|---|
| Rising time-to-repeat | Slowing engagement before cancellation | Outreach or check-in call |
| Falling cohort retention | New clients underperforming older ones | Onboarding review |
| Contraction in waterfall | Existing accounts downgrading | Value report or QBR |
| Flat or declining NRR | Overall book shrinking despite new sales | Executive review |
This kind of structured review, paired with segmentation research like Skopos’s guide to customer churn research, gives account teams a prioritized list instead of a gut feeling about which clients need attention first.
Concrete retention actions driven by report findings
Once a report flags risk, the response needs to be specific and fast. A generic “check in with the client” email rarely moves the needle. A structured playbook does.
- Run a quarterly business review (QBR) under 45 minutes, with an executive from your team present, built around dollar-value outcomes rather than activity metrics. Clients with executive participation in these reviews are roughly 2.5 times more likely to renew, according to Gainsight’s guide on the format, and a partner breakdown of QBR structure echoes why consistent executive involvement changes the tone of the conversation.
- Replace passive dashboards with proactive value reports sent on a set cadence, since Gartner’s guidance on value reporting found that concise, proactive reports defend renewals better than dashboards clients have to log in and interpret themselves.
- Segment your response by signal type: win-back sequences for lapsed cohorts, expansion offers for your heaviest users, and a refreshed onboarding touch for cohorts showing early quality issues.
- Measure whether the intervention worked using the same metrics the report flagged in the first place: NRR, retention rate, and time-to-repeat, ideally with a simple A/B comparison between treated and untreated accounts.
Pro Tip: Send the value report before the client asks for one. Waiting until renewal season to prove progress puts you on the defensive right when you need leverage.
Using white-label reporting and agency tools to retain clients
A client who receives a branded, client-ready report perceives more value than one who gets a generic export or a login to a shared dashboard. The report itself becomes part of the service, not just a receipt for work already done.
For agencies managing local SEO specifically, that means reports need to show more than traffic. They need to show:
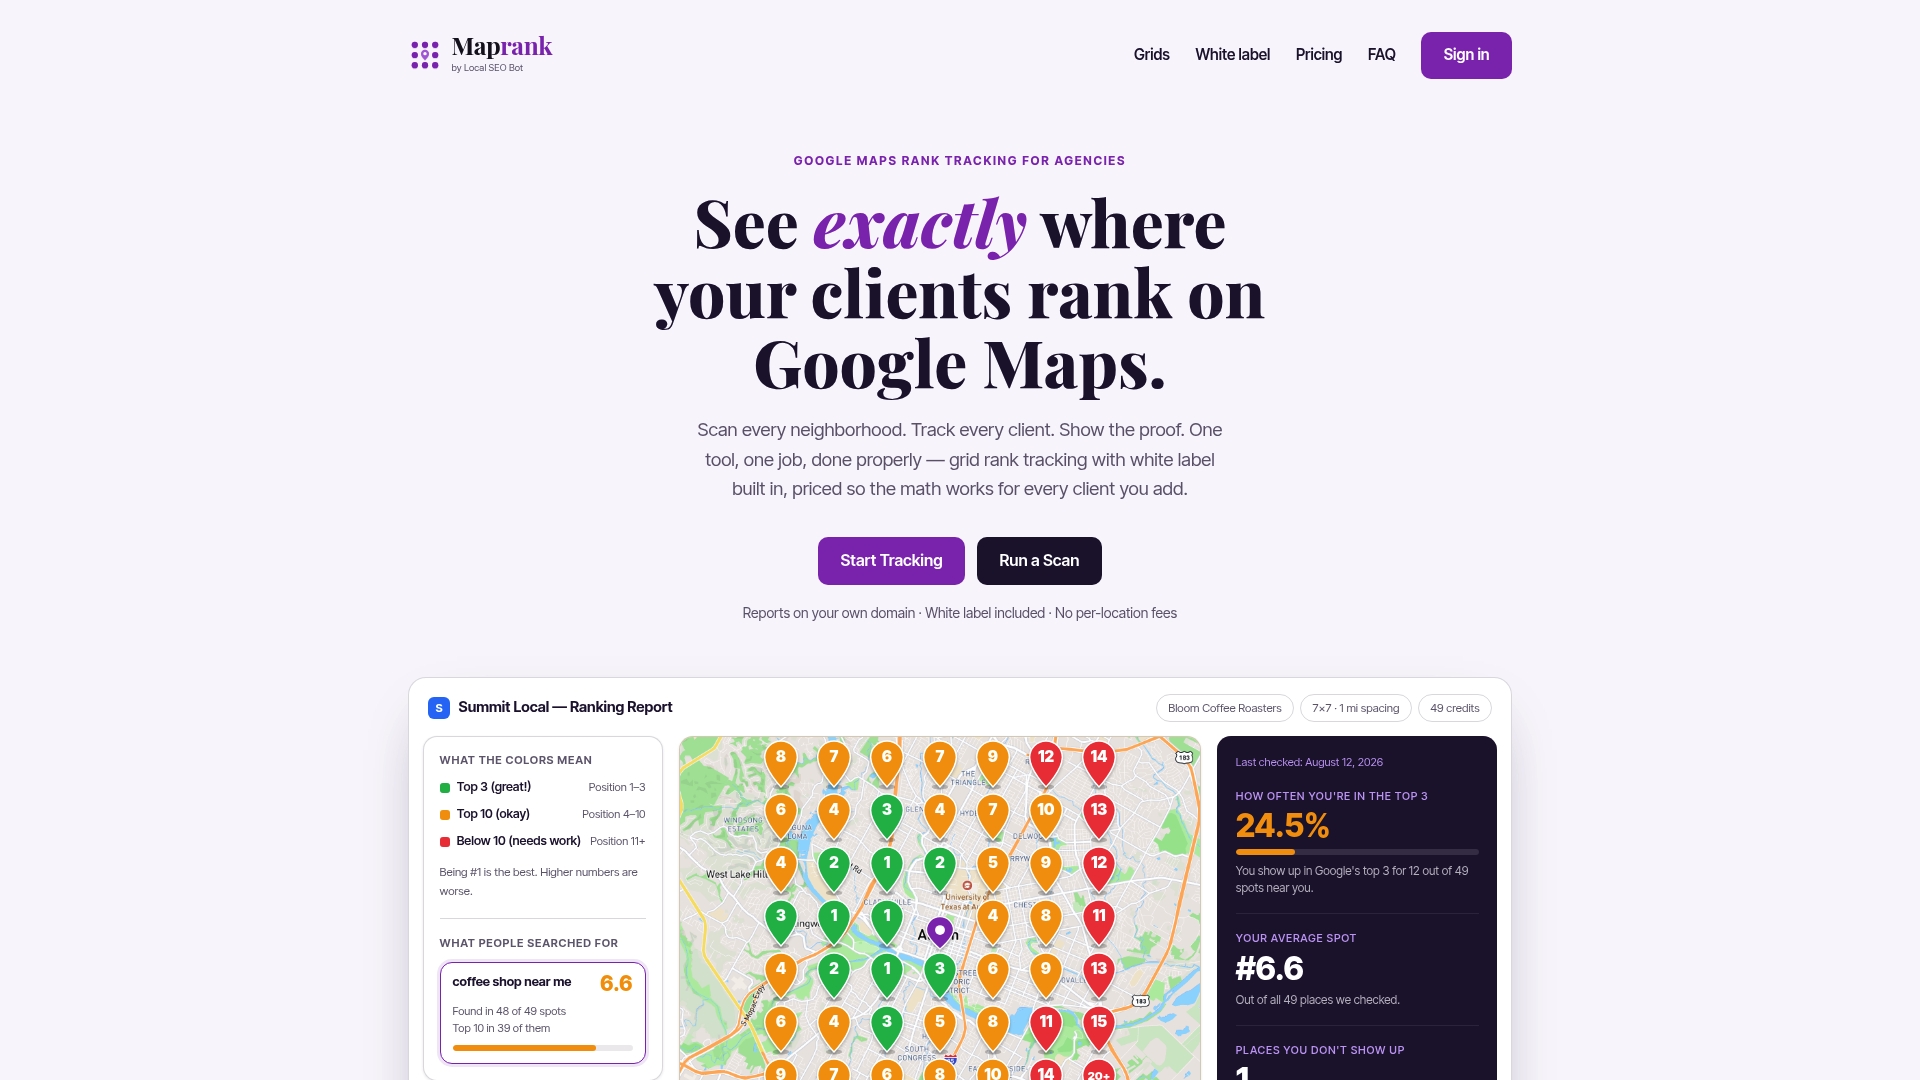
- Precise Google Maps ranking positions by neighborhood or grid point, not just a single average rank
- Market gaps, meaning areas where a client’s visibility drops off relative to competitors nearby
- Movement over time, so a client can see improvement across a quarter, not just a snapshot
Grid-based rank tracking makes this possible because it maps visibility across many points in a service area, rather than relying on one rank check from company headquarters. Reporting on local rank tracking across a whole service area gives agencies the granularity to point to specific neighborhoods where rankings improved, which turns an abstract SEO report into evidence a client can act on.
A report a client can read in five minutes and understand without a call defends a renewal better than a dashboard they never open.
Example report configurations and real-world uses
A few report presets cover most retention use cases without requiring custom analytics work:
- Location-level retention: compare revisit percentage for a single location against the portfolio average to find where service quality or local competition is causing leaks.
- Employee-level retention: track repeat rates by account owner to identify where additional training or support would help, rather than assuming churn is always about the client.
- Revenue retention preset: build an NRR waterfall with a rolling 90-day trend line, refreshed automatically so no one has to rebuild it manually each quarter.
- Distribution: automate recurring report delivery to stakeholders on a fixed schedule, which keeps the retention conversation ongoing instead of reactive, an approach outlined in guidance on scaling rank tracking and reporting for agencies.
Methods for benchmarking client retention against industry standards
Retention numbers mean little in isolation. A 70% annual retention rate might be strong in one category and weak in another, so benchmarking requires comparing against the right reference group, not an industry-wide average pulled from an unrelated sector.
Start by segmenting your own historical data by client type, region, and contract size, then treat your best-performing segment from a prior period as an internal benchmark before reaching for an external one. This avoids the common mistake of comparing a boutique regional agency’s numbers against aggregated figures from a vastly larger national pool.
When an external reference is useful, look for benchmarks published by organizations that define their metrics clearly, including the time window, cohort rules, and whether figures reflect revenue or headcount. A benchmark without a stated methodology is not comparable to your own numbers, no matter how close the figure looks.
Agentic and AI-driven monitoring tools are increasingly used to flag at-risk accounts in near real time, which Gartner’s research on agentic analytics ties to faster churn prediction and quicker playbook activation. That speed matters for benchmarking too: the sooner you can compare a client’s trajectory against a reference curve, the sooner a deviation becomes actionable rather than historical.
Consistency in definitions matters as much as the benchmark itself. Research on customer metrics has shown that switching between similar-sounding definitions, such as satisfaction scores measured on different scales, can reverse the conclusions you draw from a comparison, a point raised in AMA research on predictive customer metrics.

Why reporting should tie to customer economics
The retention reports that actually change behavior are the ones tied to dollars, not just counts. A client count that holds steady while contribution margin erodes is not a retention win, it is a slower-motion version of the same problem.
Keep reports simple enough to run the same way every quarter, and share them on a fixed schedule rather than only when something looks wrong. That consistency is what forces marketing and finance to agree on what “retained” actually means, which is the real alignment problem most retention dashboards never solve.
— Local
How Maprank supports retention reporting for local SEO agencies
For agencies running local SEO, the report itself is often the product a client sees most often, and we built Maprank around making that report worth sending. Grid-based tracking shows precise Google Maps positions across a client’s service area without requiring a Google account integration, and plans include white-label reports that go out on your own domain, not ours.
- Unlimited businesses included, so you are not paying per location just to report accurately
- Customizable scan grids that match how a client’s actual service area looks, not a generic radius
- Straightforward, credit-based pricing without surprise per-account fees as your client list grows
If you want to see what this looks like before committing to a plan, start with a one-off rank check on a current client, or explore Maprank’s full feature set to find the plan that fits your reporting cadence.
FAQ
What are the 8 C’s of customer retention?
Definitions of common metric categories vary by source, and no single authoritative framework is referenced consistently in the research behind this article. A more reliable approach is to track the specific metrics covered above, retention rate, NRR, GRR, and cohort trends, rather than relying on a mnemonic list.
What is considered a good client retention rate?
A good retention rate depends heavily on your industry, client type, and contract length, so there is no single universal benchmark. Comparing your own historical cohorts and segments against each other is more reliable than chasing an external number without matching methodology.
What are the three R’s of customer retention?
Like some mnemonic frameworks, the “three R’s” is not a standardized industry framework supported by the sources behind this guide. Retention reporting that tracks repeat rate, revenue retention, and risk signals by cohort covers the same ground without relying on an unverified acronym.
What is the best way to retain clients?
The most reliable approach combines regular reporting with proactive outreach: run quarterly business reviews with executive participation, since that format is linked to roughly 2.5 times higher renewal likelihood, and send concise value reports on a set cadence rather than waiting for clients to ask. Pairing that cadence with white-label, client-ready reports from a tool like Maprank makes the evidence easy for clients to see and act on.
Sources
- Quarterly business reviews (QBRs) — Gainsight Essential Guide
- Drive Customer Retention for AI Solutions With Value Reports — Gartner
- Linking the value of customers to enterprise value — AMA
Recommended
- White Label SEO Reports: How to Deliver Professional Client Reports That Win Renewals
- White Label Local SEO Reporting Tool: Deliver Professional Reports Under Your Brand
- White Label SEO Reporting Platform: The Complete Guide for Agency Owners
- White Label SEO Rank Tracker: Build Client Trust With Branded Reporting