Competitor Grid Tracking: 5 Steps to White Label Agency Reports
Competitor Grid Tracking: 5 Steps to White Label Agency Reports

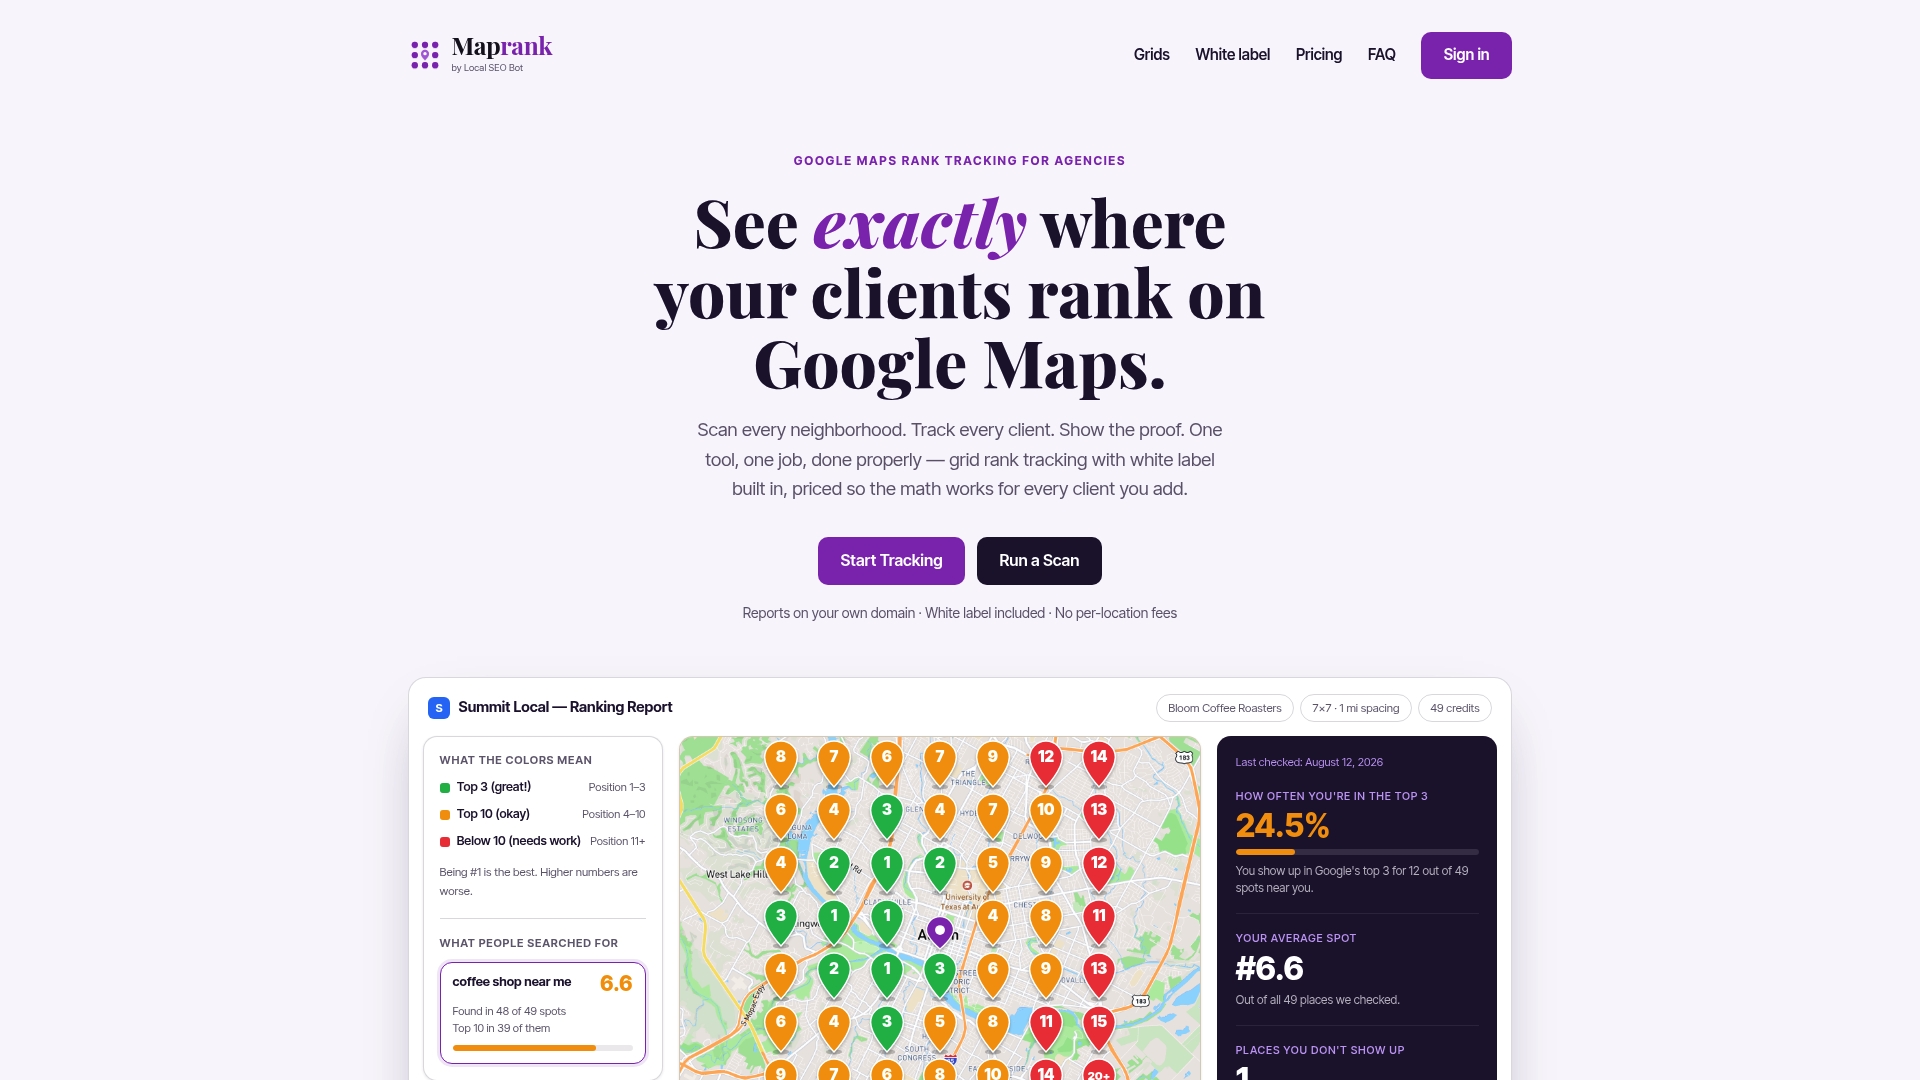
Competitor grid tracking is a controlled set of Google Maps scans that logs which businesses appear, and where, across a grid of geographic cells. It gives agencies neighborhood-level map-pack visibility they can show clients as proof and use to steer local strategy. Pair it with first-party Business Profile Performance API data, and tools like Maprank turn both into one reportable story.
TL;DR:
- Run a baseline scan at onboarding, then monitor standard clients monthly and premium tiers or active campaigns weekly, keeping query, device, and locale fixed.
- Use grid scans to measure controlled geographic visibility, but pair them with Business Profile Performance data to learn whether people find and interact with listings.
- Validate each branch’s coordinates and profile identifier before scanning, since one address can resolve to multiple nearby locations and distort the results.
- Use wider cell spacing for broad service areas, tighten grids in dense neighborhoods, and add cells only when client decisions justify the extra scan credits.
- Include rank heat maps, coverage percentage, change charts, raw scans, and settings in client reports so clients can inspect the evidence behind recommendations.
Table of Contents
- How grid scans differ from Business Profile performance data
- When grid tracking earns its place in your agency
- A repeatable workflow for reliable scans
- Designing grids that give resolution without waste
- Metrics worth reporting and how to join them to performance data
- What belongs in a white-label client report
- Why scaling beats perfecting
- Run grid tracking without the per-location fees
- FAQ
- Sources
How grid scans differ from Business Profile performance data
A grid scan sends the same query from many controlled origins and records who shows up in each cell. It answers one question: where does this profile appear for a controlled query? Performance data answers a different one: how are real people finding and interacting with this profile? Google’s Business Profile Performance API covers the second question, and Google’s help center explains that you can review views, clicks and interactions for one or several profiles and compare locations over time.
Each source has limits. A scan is a simulated searcher at a chosen point, so it says nothing about who actually searched. Performance data reflects real behavior but cannot tell you what a competitor three blocks away is doing. Treat them as complementary, not interchangeable.

When grid tracking earns its place in your agency
Grid scans pay off when a client needs geographic proof rather than a single rank number.
- New client audits: a baseline scan shows where the profile is strong and where it vanishes.
- Coverage checks for service-area businesses: you see which neighborhoods they reach and which belong to rivals.
- Multi-location benchmarking: comparing branches on the same grid settings shows which location underperforms.
- Pre and post measurement: scan before a citation cleanup or category change, then again afterward to prove the effect.
- Competitor watching: repeat scans show which rival is gaining ground in which cell.
For cadence, run a deep audit scan at onboarding, then monitor monthly for standard clients and weekly for premium tiers or active campaigns. The outputs map cleanly to client KPIs: cell-level rank becomes visibility, and the share of cells where the client appears becomes map-pack coverage. Our walkthrough of a local SEO grid tracker shows this on a full service area.
A repeatable workflow for reliable scans
Bad inputs produce misleading heat maps, so start with clean records.
- Inventory every location. Capture the canonical address, primary and secondary categories, and latitude and longitude. Google’s matching-listings guidance stresses that address and coordinate quality affect which place gets returned.
- Normalize identifiers. Tie each scan to one profile. Google notes that a single address can resolve to multiple nearby locations and may need manual coordinate adjustment, so validate coordinates for every branch. The Location resource documents which fields a record holds.
- Define controlled queries. Use identical query text, device and locale for every scan in a series, and plan one origin per grid cell.
- Set cadence and store raw outputs. Keep every scan linked to its profile ID so trends stay comparable.
- Quality-check ambiguous matches. Re-run them and log any manual overrides.
Pro Tip: Keep a one-page settings record per client (query, locale, grid size, origin rule) so a teammate can reproduce a scan later.
Designing grids that give resolution without waste
Grid design is a trade between detail and cost. These rules keep both in check:
- Spacing: use coarse spacing for wide service areas or a first audit, and tighten it in dense urban areas where rankings change block to block.
- Density: more cells mean more scan credits, so go dense only where a client’s decisions depend on it.
- Origins: place points on a consistent pattern, such as a centered square, and anchor the middle cell on the business itself.
- Query control: hold query wording, device and locale constant so differences between scans reflect rankings, not settings.
- Rank over labels: a 2026 analysis of Maps architecture notes that map rendering and label visibility are distinct from ranking, so capture rank data, not only what happens to be drawn on screen.
Google’s own local ranking tips remind us that relevance, distance and prominence drive local results, which is why origin placement matters so much.
Metrics worth reporting and how to join them to performance data
Track grid metrics such as cell-level rank, map-pack appearance rate, percent coverage and trend deltas between scans. Then add the first-party layer. Business Profile impressions and keyword impressions tell you whether visibility gains in a neighborhood line up with real search demand.
Monthly search keyword impressions are available per location, aggregated by month and paginated for large datasets. Lay those monthly totals beside your scan dates and you can see whether a coverage jump coincided with more impressions.
For presentation, use:
- Heat maps of rank by cell
- A coverage percentage headline
- Change-over-time charts across scans
- Raw scan exports attached for transparency
Clients trust numbers they can inspect. Our guide to geo grid visualization covers chart choices in more depth.
What belongs in a white-label client report
A good report is short up front and deep in the back.
- Executive snapshot: one paragraph on what changed, plus the top three action items.
- Map visuals: a heat map of visibility, with neighborhoods that gained or lost rank called out.
- Data appendix: the raw scan table, a Business Profile performance snapshot and the query and control settings used.
- Delivery: scheduled PDF exports or reports on your own branded domain, sent on a predictable rhythm.
Predictable, branded reporting is what keeps clients seeing your agency as the source of their local growth, which supports retention. If a client also needs on-profile fixes, a practical Business Profile guide can back up your recommendations.
Pro Tip: Lead every report with the single neighborhood where the client improved most. A concrete win frames the rest of the data.
Why scaling beats perfecting
The agencies that make grid tracking work treat it as a product, not a favor. Define tiers: a baseline audit for everyone, monthly monitoring for most, weekly scans and extra reports for premium accounts. Then automate the boring parts: scheduled scans, exports and a canonical location record kept current, so no one hand-edits coordinates before every report. Predictable pricing matters here, because per-location surprises erode margin as the client list grows. The strongest narrative still comes from combining scans with performance data: scans show where you appear, performance data shows what people did about it. Skip either and the story has a hole.
— Local
Run grid tracking without the per-location fees
We built Maprank for exactly this workflow. You get customizable scan grids, white-label client reporting on your own domain, unlimited businesses on every plan, and credit-based scans, with no Google account integration required. Most agencies start with a one-off rank check on a single client, then move to a subscription for recurring scans once they have seen the heat map. Current prices are on our plans page. Run your first scan this week and put a real map in front of your next client.
FAQ
What is competitor grid tracking?
Competitor grid tracking runs the same Google Maps search from many points across a geographic grid and records which businesses appear in each cell. It shows neighborhood-level visibility for a client and its rivals.
How is it different from Business Profile performance data?
Grid scans show where a profile appears for a controlled query. Performance data shows how real people find and interact with it. Agencies get the full picture by using both.
How often should I run scans?
Run a baseline audit at onboarding, then monthly for standard clients and weekly for campaign or premium accounts. Keep queries, locale and grid settings identical so each scan stays comparable.
Why do branch locations get mixed up in scans?
A single address can resolve to several nearby locations, so accurate coordinates and unique identifiers matter. Google’s matching guidance recommends manual coordinate adjustment when needed.
Sources
- Search for matching listings | Google Business Profile APIs | Google for Developers
- Business Profile Performance API | Google Business Profile APIs | Google for Developers
- Inside Google Maps: 72 ranking signals and the architecture behind local search