GBP Ranking Report: What to Include and How to Build One
GBP Ranking Report: What to Include and How to Build One

A GBP ranking report shows where a Google Business Profile appears in Google Maps and local results for specific keywords, measured from many points around the business instead of from one. The best ones pair a grid of rank positions with profile performance data (calls, clicks, direction requests), a plain-language read of what changed and a short list of next steps. This guide covers what belongs in the report, how to keep the numbers fair, and how agencies turn the report into something clients look forward to.
TL;DR
- A useful GBP ranking report combines a geo-grid rank map, profile performance data and a short written summary of work done and work planned.
- Local rankings change with the searcher’s position, so a single “rank #3” number tells you very little. A grid shows where a business wins and where it vanishes.
- Compare reports fairly: keep the same keywords, grid size, spacing and center point from scan to scan.
- Weak zones on the grid are your to-do list: they point to the neighborhoods, keywords and profile gaps worth fixing first.
- White-label delivery on your own domain makes the report a retention tool, not just a data dump.
Table of Contents
- What a GBP ranking report actually is
- How geo-grid tracking reports Google Maps rankings
- Why reported rankings vary by location and over time
- What to put in the report
- How to compare reports fairly
- Turning weak areas into an action plan
- Presenting the report to clients
- Our perspective: why we built Maprank around the grid
- Build your GBP ranking reports with Maprank
- Frequently asked questions
- Sources
What a GBP ranking report actually is
Two different things get called a “GBP report”, and the confusion costs agencies time.
The first is performance data from Google itself. Verified owners and managers can see how people find and use a profile, including views, clicks and other interactions across Search and Maps, in Google’s Business Profile performance insights. That tells you what happened after someone saw the listing.
The second is a ranking report, which answers a different question: where does the listing show up before anyone clicks? It records the position of a business for a keyword such as “emergency plumber” or “dentist” from a set of locations. Insights cannot tell you that a business is invisible two miles north of its address, because nobody in that area ever saw it, so nothing was recorded.
A strong report uses both. Rankings show the opportunity, insights show the outcome, and the gap between them is where the story is.

How geo-grid tracking reports Google Maps rankings
Google Maps results are personal to location. A search run from one block can return a different top three than the same search from a mile away. That is why a ranking taken from a single point, or from a generic national rank tracker, misleads.
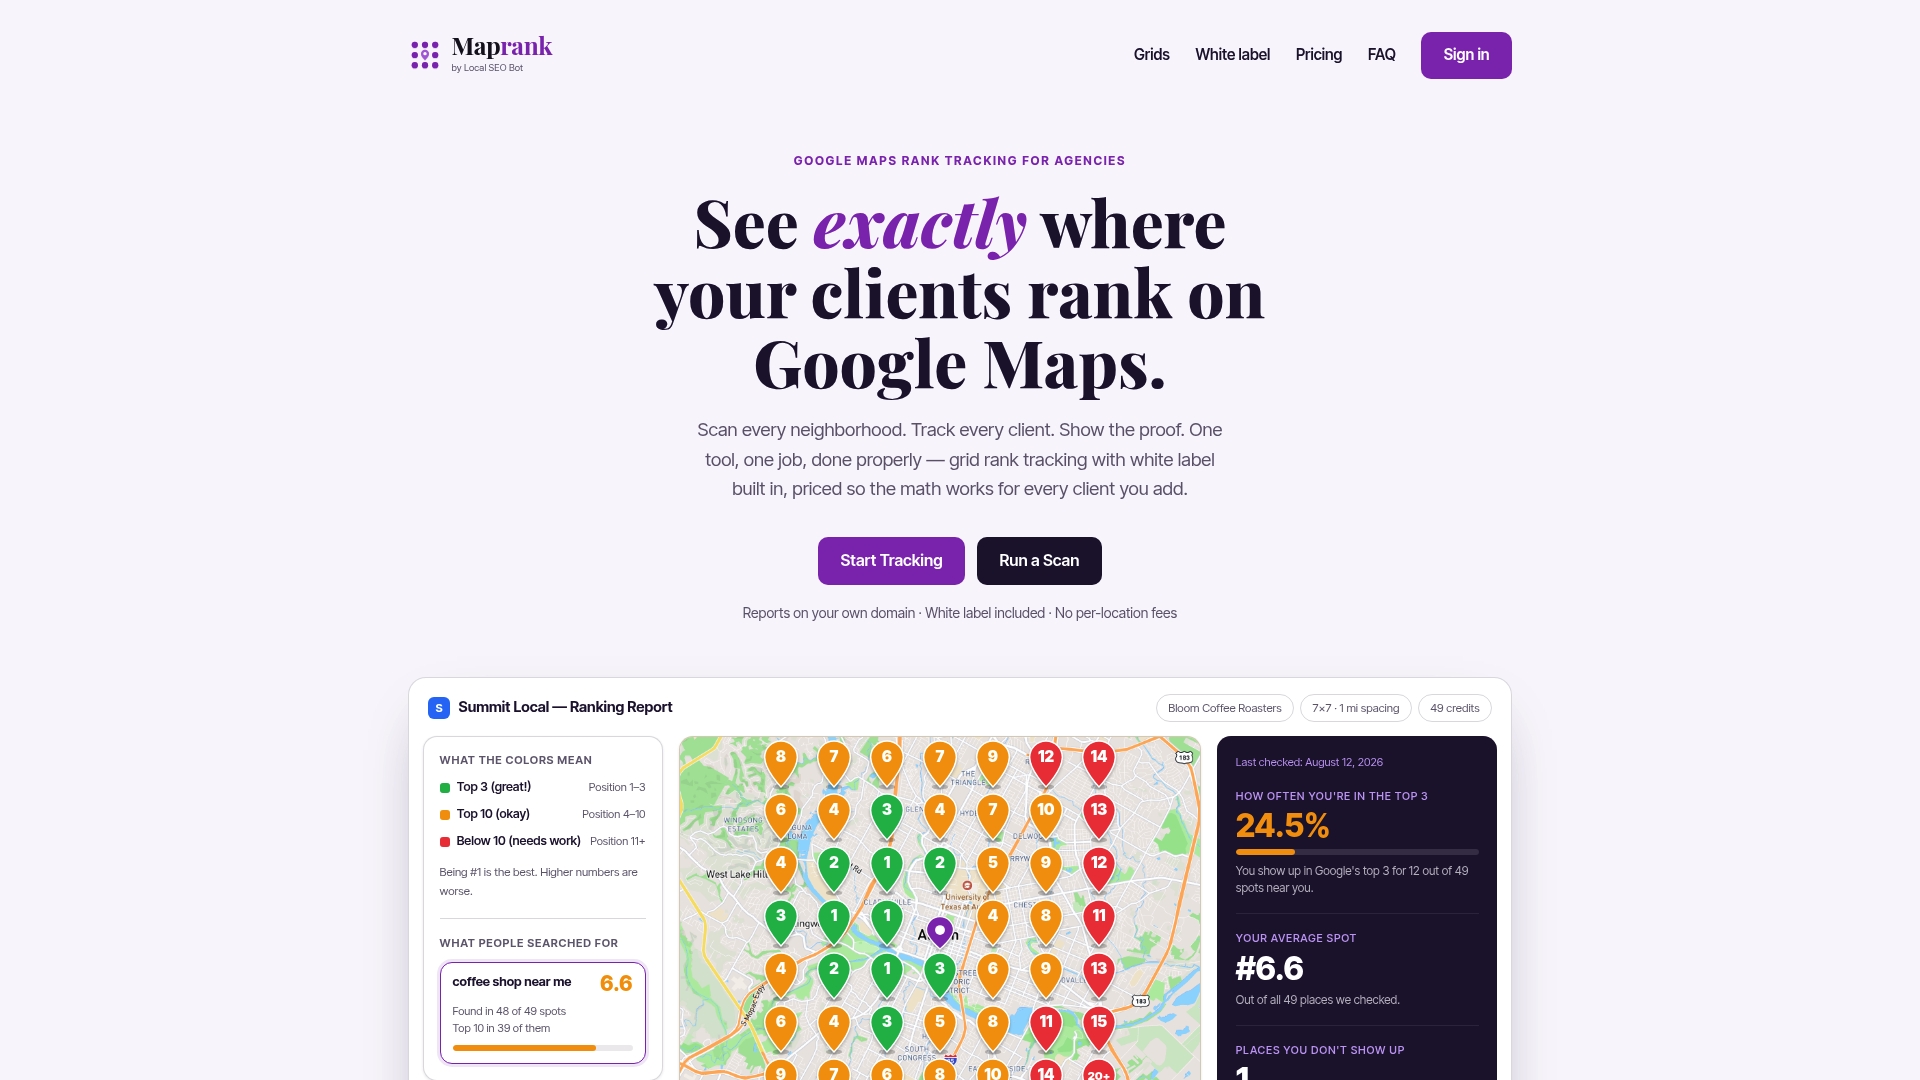
Grid tracking solves this by placing a matrix of points over a map, for example 5x5 or 7x7, centered on the business. At every point, the tool runs the same search as if the searcher stood there and records where the business appears. The result is a color-coded map:
- Green points mean the business sits in the top three, the local pack.
- Amber points usually mean positions four to ten.
- Red points mean the business is lower, or missing from the results.
Two numbers summarize a grid. The average rank across all points is a quick trend line. Map pack coverage, the share of grid points where the business is in the top three, is easier for clients to grasp: “you appear in the top three in 14 of 49 spots around your shop, up from 9 last month.”
Grid size and spacing matter more than most people expect. A tight grid with half-mile spacing suits a dentist whose patients live nearby. A wider grid suits a service-area business such as a roofer who travels across a county. Pick the footprint that matches where the client’s customers actually live, not whatever default the tool offers.
Why reported rankings vary by location and over time
Before you show a client a drop, know why rankings move. Google says local results are based primarily on relevance, distance and prominence, and that a farther business can outrank a closer one when it seems a better match. Here is what that means in practice.
Distance is built in. Businesses nearly always rank best close to their pin and weaker as the searcher moves away. A grid makes this visible, and it also shows where a competitor’s pin has the home advantage.
Competitors change. A rival that adds a category, collects reviews or opens a second location can push you down without you changing anything.
The keyword changes the map. The same business can be a green blanket for “family dentist” and a patchwork for “emergency dentist”. Always report per keyword.
Results fluctuate. Day-to-day movement is normal. One scan is a snapshot, so trends over several scans are what you report.
Settings differ. If a scan uses a different grid size, spacing, keyword wording or center point, the two maps are not comparable, even when they look alike.

What to put in the report
Keep the report short enough to read in five minutes. Here is a structure that works.
1. A one-paragraph summary
Start with the verdict in plain words: what improved, what slipped, and what you are doing about it. Clients who read nothing else will read this. Skip jargon; “more people near the north side can now find you” beats “improved proximity-weighted visibility”.
2. The grid map for each priority keyword
Show the current grid beside the previous one. Limit it to the three to five keywords that bring the client revenue. More than that and the signal drowns.
3. Coverage and average rank over time
A simple line chart of map pack coverage across the last six or twelve scans shows direction better than any single map.
4. Profile performance
Pull in calls, website clicks, direction requests and views from the client’s Business Profile performance data. These are the numbers clients actually care about, because they can feel them in their phones.
5. Competitor context
Show the two or three businesses taking the spots the client misses. Seeing a competitor dominate the south side of town makes the weak zone concrete.
6. Work completed and next steps
List what you did (new categories, service descriptions, photos, review requests, citations cleanup) and what comes next. A report that links activity to results is the one that survives budget reviews. For a deeper look at cadence and delivery, this guide to local SEO reporting covers how to automate delivery while still explaining completed work and upcoming actions.
How to compare reports fairly
A report is only trustworthy if scan A and scan B can be compared. Use this checklist before you send anything.
| Check | Why it matters |
|---|---|
| Same center point | Moving the center shifts every grid point and changes every rank. |
| Same grid size and spacing | A 5x5 and a 9x9 grid cannot be compared on coverage percentages. |
| Same keyword wording | “Plumber” and “plumbing services” can return different packs. |
| Same business listing | Confirm the tracked profile matches the verified one, including name and address. |
| Similar scan timing | Run scans on a consistent schedule, such as the same day each week or month. |
| Noted changes | Record any profile edits, category changes or address updates that happened between scans. |
If any setting must change, say so in the report and start a new baseline rather than pretending the trend line continues.
One more point on reliability: tools that require access to a client’s Google account can only report on profiles they are connected to. Tracking from outside, by public search results from grid points, lets you scan a prospect or a competitor with no login, which makes pitches and benchmarking far easier.
Turning weak areas into an action plan
The grid’s red zones are the most valuable part of the report. Read them in this order.
- Find the pattern. Are weak points clustered on one side (distance from the pin), spread everywhere (a relevance or prominence problem), or tied to one keyword?
- Name who wins there. Open the competitors holding the top spots in the red zone. Compare their primary category, review volume and recency, photos and service descriptions.
- Check the profile basics first. Google advises that completing business details, such as accurate hours, categories and descriptions, helps relevance and prominence. Fix the profile before chasing more reviews is a sensible order of work for small businesses, since basics are cheap and quick.
- Choose one or two moves per cycle. Adding a service-area page, tightening the primary category or running a review request campaign aimed at customers in the weak neighborhood are all testable.
- Rescan with identical settings after the change has had time to take effect, and report the before and after.
A realistic example: a clinic shows green around its address but red to the east, where a competitor has a pin closer to those streets. Rather than promising to “win the east side” (distance may make that unrealistic), you target the keywords where the clinic has a real edge, strengthen content for that area and report coverage gains honestly. Setting expectations about what proximity allows is part of professional reporting.
Presenting the report to clients
Data does not retain clients; clarity does. A few habits make the difference.
- Lead with business outcomes. Calls, direction requests and leads come first, ranking maps second.
- Use your brand, not the tool’s. A report on your own domain with your logo reads as your work product.
- Keep a fixed rhythm. Monthly delivery with a short call or email keeps you present even in quiet months.
- Explain red without apology. A red zone with a plan is an upsell conversation. A red zone with no explanation is a cancellation risk.
We go deeper on this in our guides to white-label SEO reports that win renewals and client retention reporting for local SEO agencies.
Our perspective: why we built Maprank around the grid
Most agencies we talk to are not short on data. They are short on a report they can send without rebuilding it by hand and without a pricing model that punishes growth. That is what shaped Maprank.
We believe the grid is the honest way to show Google Maps visibility, because it shows where a business is weak as clearly as where it is strong. We also believe the tool should stay out of the agency’s way. That is why every plan includes unlimited businesses and white-label reporting on your own domain, why you pay for scan credits instead of per-location fees, and why nothing requires connecting a client’s Google account. Adding a client or a team member should not trigger a price change.
Our advice for any agency: pick a small set of keywords, fix your grid settings, scan on a schedule and let the trend do the talking. Resist the urge to show everything.
— Local
Build your GBP ranking reports with Maprank
Maprank gives agencies, consultants and freelancers grid-based Google Maps rank tracking with customizable grid sizes and spacing, white-label reports on their own domain and unlimited businesses on every plan. Pricing runs on scan credits: Solo is $19 per month ($228 per year), Agency is $39 per month ($468 per year), Pro is $79 per month ($948 per year) and Scale is $149 per month ($1,788 per year). Plans scale by credits, seats and grid size, and the white-label features are on all of them.
If you want to see the grid before committing, try the Google Maps rank checker, or compare plans on the Maprank pricing page. For a broader view of how the tool fits agency workflows, see our local SEO rank tracker overview.
Frequently asked questions
What is a GBP ranking report?
It is a report showing where a Google Business Profile ranks on Google Maps and in local results for chosen keywords, usually from many points around the business. Good ones add profile performance data such as calls and direction requests, plus a written summary of the work done.
How often should I send a GBP ranking report?
Monthly works for most local clients, with scans on a consistent schedule so results compare cleanly. Highly competitive markets or active campaigns can justify weekly scans, with the client report still going out monthly.
Why does my ranking look different from what my client sees?
Local results depend on the searcher’s location, so your result from the office rarely matches theirs. A grid report shows the spread of positions across the area, which explains why a client in one neighborhood sees a different result than one across town.
Do I need access to the client’s Google account to build the report?
Not for ranking data. Grid scans use public search results from each point, so you can run them without a login. You will need verified access to the profile only to pull Google’s own performance data, such as calls and clicks.
Which metrics matter most to non-technical clients?
Map pack coverage, calls, direction requests and website clicks. These tie directly to customers, while average rank and similar technical figures work best as supporting detail.
Sources
- Understand your Business Profile performance and insights (Google Business Profile Help)
- Are Relevance, Distance, and Prominence Google Ranking Factors? (Search Engine Journal)