Defensible Agency Reporting: Geogrid Accuracy and Top Three Coverage
Defensible Agency Reporting: Geogrid Accuracy and Top Three Coverage

Geogrid accuracy measures how precisely a scan grid reflects local ranking across different points in a service area, not whether a business holds one fixed citywide rank. The practical rule: report coverage, top-three share, and change versus the prior scan rather than a single position. That framing matches Google’s own guidance on relevance, distance, and prominence, and it’s the approach tools like Maprank are built around for agency reporting.
TL;DR:
- Geogrid accuracy measures how well a scan grid captures local visibility variations across different points rather than a single fixed position.
- Using a 3x3 grid provides a trend overview but is unreliable for total coverage, while 5x5 or 7x7 grids offer better resolution for mapping catchment areas and expansion points.
- Variations in searcher location inputs, grid configuration, and address geocoding can significantly influence scan results, requiring careful validation and consistent placeId logging.
- Reporting should focus on stable metrics like share of grid points in top three and coverage change over time, with detailed documentation of scan settings for accuracy.
- Running scans weekly for trends and confirming changes with repeat scans improves reliability, while a single scan serves only as an observation, not a definitive ranking.
Table of Contents
- What geogrid accuracy means and why a grid is the right instrument
- Factors that affect geogrid accuracy
- Choosing grid size and spacing without overspending on scans
- Defensible metrics to report to clients
- Data quality checks and validation steps
- How to reduce measurement error and improve precision
- Setting client expectations around a single scan
- Running these practices without the overhead
- FAQ
- Sources
What geogrid accuracy means and why a grid is the right instrument
Local ranking depends on relevance, distance, and prominence, and Google states plainly that distance is calculated from the searcher’s location or an estimate when none is shared. That single fact explains why a business can sit in the top three a few blocks from its address and fall out of the pack ten minutes away. A grid solves this by sampling many points across a neighborhood instead of one downtown coordinate.
Independent testing backs this up. HasData’s geo-grid experiments in New York and Boise found real coverage differences and positional churn across grid points, with results shifting block by block rather than smoothly. A grid shows you where visibility is strong, where it drops off, and which direction the edges lean, something a single search can never reveal.

What a grid cannot do is prove a permanent position. Google keeps its ranking system confidential, and retrieval and scoring happen through multiple systems that can change which businesses are even considered before ranking order is decided. A grid is a snapshot of visibility shape at a point in time, not a guarantee.
Factors that affect geogrid accuracy
Several variables shift scan results independent of actual ranking changes, and agencies need to account for each one before drawing conclusions for a client.
- Grid geometry: spacing, point count, and alignment all change resolution and the cost of running a scan.
- Searcher location inputs: device GPS versus IP-estimated location produces different distance calculations and different results.
- Place matching stability: tracking by name or website instead of placeId breaks continuity when a listing changes.
- Geocoding precision: imprecise addresses or multiple partial matches point the scan at the wrong coordinates.
- Rendering versus retrieval: a business can be ranked and eligible yet not visible on the map label layer, a distinction Search Engine Land’s analysis draws out clearly.
Pro Tip: Always log the placeId alongside every tracked point. Names and websites change; placeId is the one identifier that keeps month-to-month comparisons honest.
Choosing grid size and spacing without overspending on scans
Grid configuration is a trade-off between resolution and scan cost, and the right choice depends on what question you’re answering for the client.
- 3x3 coarse grids work for trend detection on a limited budget. HasData’s testing found a 3x3 useful for directional signals but unreliable for measuring total coverage.
- 5x5 grids add enough points to start mapping where visibility drops off between the center and the edges of a service area.
- 7x7 grids with tighter spacing serve as the reference configuration when you need to map a competitor’s catchment or decide where a client should expand physically.
Spacing should scale with market density: a suburban service area might use half-mile spacing across a 5x5 grid, while a dense urban core needs quarter-mile spacing or finer, since top-three radius shrinks and positions move block by block in denser markets. Run coarse grids weekly for trend tracking, and reserve denser grids for monthly or quarterly deep dives tied to specific decisions like expansion or budget reviews.
Defensible metrics to report to clients
A handful of reproducible metrics beats a single rank number every time, because a single position is sensitive to exactly which point the search ran from.
- Share of grid points in top 3 (sometimes called share of local voice): the clearest coverage signal, and more stable run to run than any single position.
- Top-three coverage, median position, and worst position: together they describe the full shape of visibility, not just the best case.
- Change versus the prior grid: the number clients actually care about month to month.
A grid’s coverage percentage only means something when the scan settings behind it are documented. HasData’s experiments found that coverage estimates shift materially with grid spacing and size, so a report has to label the query, date and time, device, ranking cutoff, and grid geometry alongside every figure. A heatmap with annotated edge cells communicates this better than a table of raw numbers, though keeping the raw point list available for audit is worth doing when a client asks how a figure was calculated.
Data quality checks and validation steps
Before a scan result goes into a client report, run it through a short validation pass.
- Match every result by placeId, not name or website, and log the placeId for each tracked point.
- Resolve partial or multiple matches using Business Profile API calls that support manual LatLng adjustment when geocoding lands on the wrong building or block.
- Check for duplicate or unverified listings and fix inconsistent address formatting that could be splitting ranking signal across two profiles.
- Require a repeat scan before reporting a material change, and set a noise threshold so normal day-to-day fluctuation doesn’t get mistaken for a real shift.
Pro Tip: Treat a single scan as a hypothesis. A second scan that confirms the movement is what makes a finding worth putting in a client deck.
How to reduce measurement error and improve precision
Most measurement error traces back to the Business Profile data itself, not the scanning tool.
- Standardize address and category fields across every location using Google’s representation guidelines, which reduce mismatches at the source.
- Add precise LatLng coordinates, and pin manually for addresses that geocode poorly, like new construction or shared buildings.
- Resolve duplicate or mis-associated profiles and confirm placeId continuity so historical data stays comparable.
- Automate scan settings and retries so transient API errors don’t quietly corrupt a dataset you report on later.
A visualization approach that pairs well with these checks is the geo-grid heatmap, which one data visualization guide walks through for showing coverage patterns at a glance rather than burying clients in a grid of numbers.
Setting client expectations around a single scan
Grids are observations, not verdicts, and the agencies that hold up best under client scrutiny are the ones who report coverage and trend rather than a single downtown position. When you recommend a local action, point to the documented scan settings behind it: grid geometry, date, device, and cutoff depth. Resist the urge to overclaim from one good result near the business address. It feels persuasive in the moment, but it sets up a harder conversation the next time the grid shifts.
— Local
Running these practices without the overhead
This tool was built around the reporting approach this guide lays out: customizable scan grids so you can match resolution to the client’s actual service area, white-label reports on your own domain, and unlimited businesses on every plan so pricing doesn’t punish you for adding clients or team members. Scans run on credits with no need for Google account integration, which keeps setup simple across a growing client list.
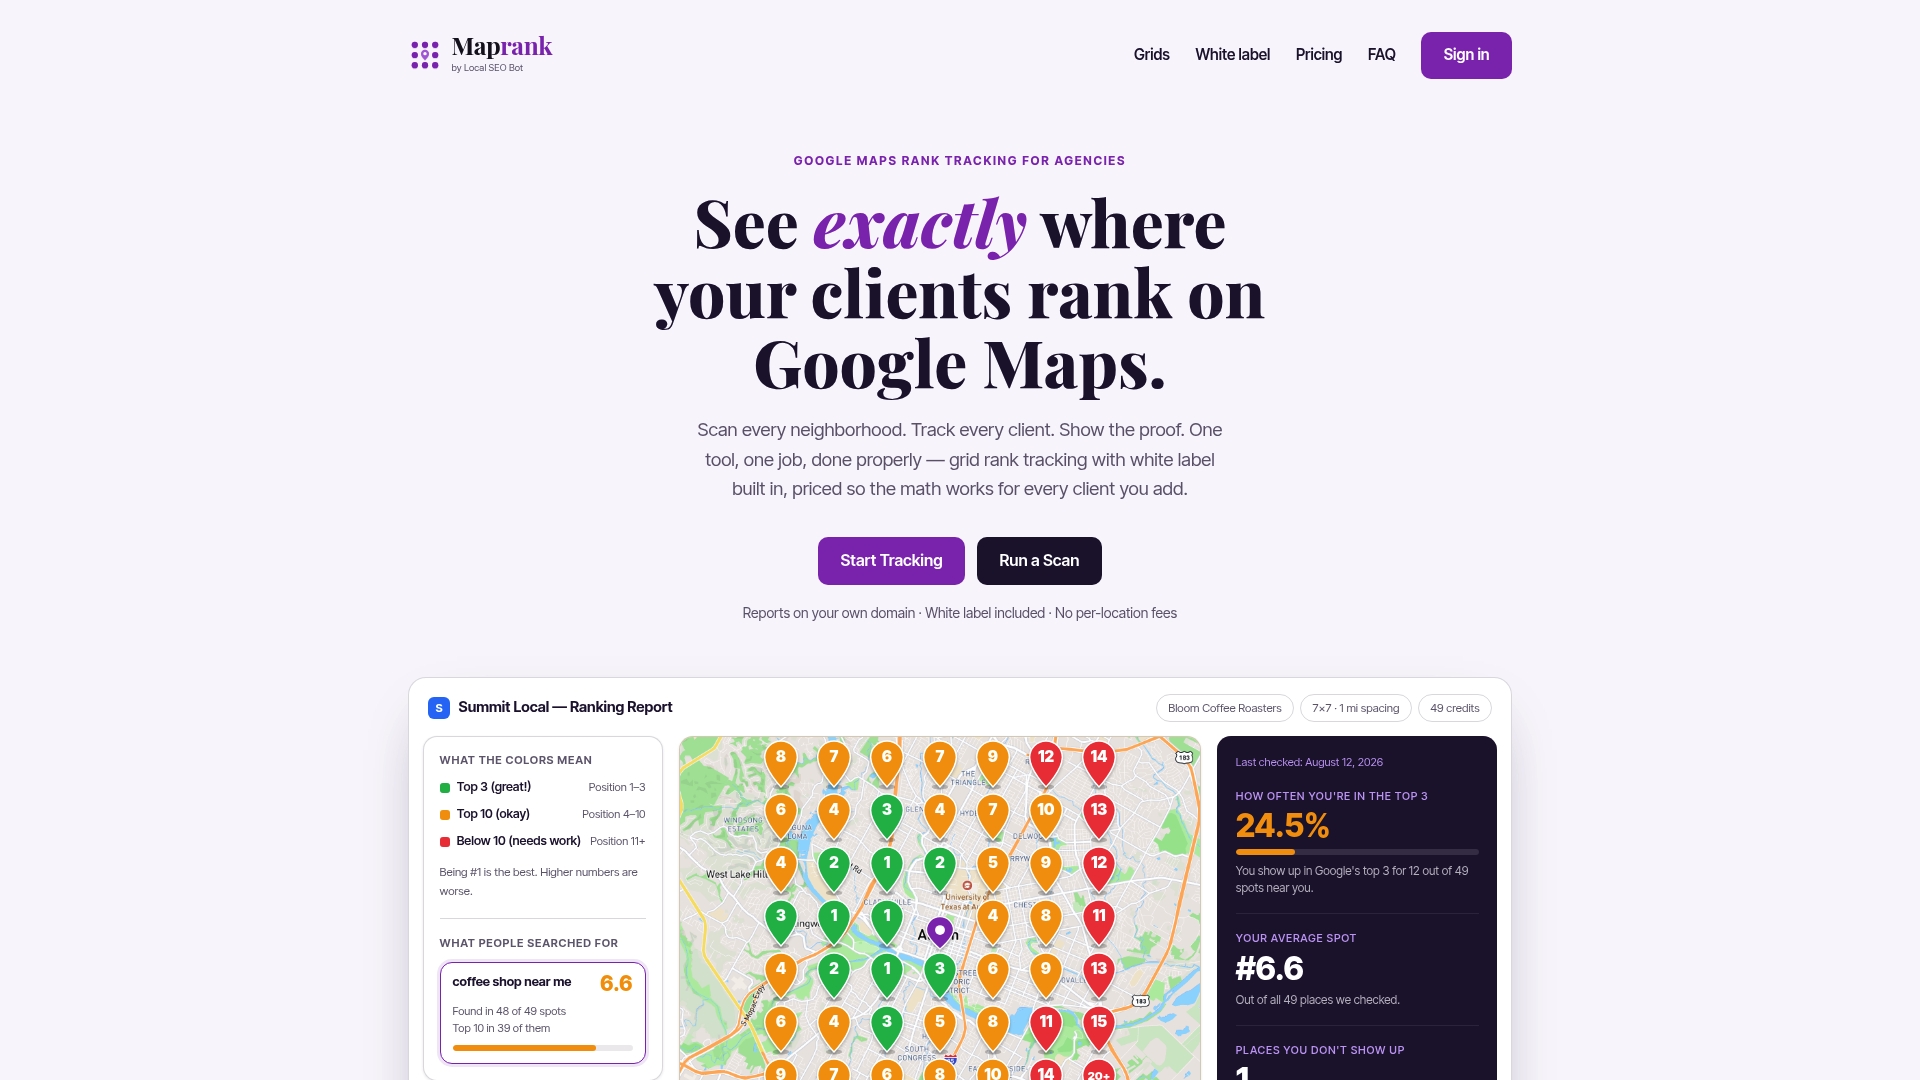
If you want to see how a grid scan looks on a real address before committing to a plan, the one-off rank check runs a single scan without a subscription. For agencies ready to standardize reporting across every client, Maprank’s plans start with Solo and scale up through Agency, Pro, and Scale as your scan volume grows.
FAQ
What does geogrid accuracy actually measure?
Geogrid accuracy measures how precisely a scan grid reflects ranking visibility across multiple points in a service area, not a single fixed position. Because local ranking depends on the searcher’s distance from the business, accuracy improves as grid resolution increases and degrades when spacing is too wide for the market.
Why does a single downtown rank check give misleading results?
A single check only reflects the ranking from one coordinate, and distance is a core ranking factor, so results a few blocks away can differ substantially. Grid experiments have documented this kind of positional churn across nearby points in the same city.
What grid size should agencies use for client reporting?
A 3x3 grid works for lightweight trend tracking, while 5x5 or 7x7 grids give the resolution needed to map catchment edges or support expansion decisions. Testing across multiple cities found 3x3 grids unreliable for measuring total coverage, which is why denser grids matter for anything beyond a quick trend check.
How often should a geogrid scan run?
Scan frequency should match the noise threshold you’ve set and the client’s need for updates, with weekly coarse scans suited to trend tracking and denser scans reserved for monthly or quarterly reviews. Repeating a scan before reporting a change helps confirm the movement is real rather than normal fluctuation.
What is the most defensible metric to put in a client report?
Share of grid points in the top three, often called share of local voice, is steadier run to run than any single position and should be reported alongside coverage change versus the prior scan. Each figure should be labeled with the query, date, device, cutoff depth, and grid geometry used, since coverage estimates shift with grid configuration.
Sources
- Tips to improve your local ranking on Google - Google Business Profile Help
- Build Your Own Geo-Grid Local Rank Tracker | HasData
- Search for matching listings | Google Business Profile APIs | Google for Developers
- Inside Google Maps: 72 ranking signals and the architecture behind local search - Search Engine Land