Agencies: Geogrid vs Heatmap, Run 5x5 Scans and Client Ready Maps
Agencies: Geogrid vs Heatmap, Run 5x5 Scans and Client Ready Maps

A geogrid is the raw data: a matrix of rankings pulled from specific coordinates across a service area. A heatmap is what you do with that data: a color-coded visual that turns dozens or hundreds of individual rank checks into something a client can understand in five seconds. The right workflow for agencies isn’t picking one over the other. Run the geogrid scan, keep the raw export for audits, and hand clients the heatmap for the story.
TL;DR:
- Geogrid scans provide auditable, cell-level ranking data across multiple locations, but are resource-intensive and generate large datasets.
- Heatmaps instantly visualize rank coverage through color-coding, effectively highlighting geographic patterns but can conceal granular detail without proper legends.
- Pairing heatmaps with raw CSV exports ensures clients see a clear visual overview while agencies maintain detailed, defendable data for audits.
- Choosing between dense, high-resolution grids for initial audits and lighter, frequent scans for ongoing tracking optimizes workload and budget.
- Maprank offers a cost-effective, white-labeled solution with unlimited business accounts, eliminating per-location fees and supporting customized visualizations.
Table of Contents
- Geogrid vs Heatmap: The Core Difference
- How a Geogrid Scan Actually Works
- How Heatmaps Turn Grid Data Into a Picture
- Weighing Geogrid Data Against Heatmap Visuals
- When to Run a Geogrid, When to Show a Heatmap
- Turning Grid Data Into Reports Clients Actually Trust
- What Executives See vs. What Auditors Need
- Get Grid Data and Client-Ready Heatmaps Without the Per-Location Fees
- Sources
- FAQ
Geogrid vs Heatmap: The Core Difference
A geogrid scan samples a business’s map-pack ranking from multiple geographic points around a fixed center, usually a downtown address, a zip code centroid, or the client’s storefront. Each point runs an independent local search and records where the business lands, or whether it shows up in the map pack at all. The output is a grid of numbers: rank 2 here, rank 9 three blocks over, no ranking at all past the highway.
A heatmap visualization takes that grid and assigns each point a color, usually green for top-3 positions, yellow for page-one-but-not-top-3, and red for absent or buried. It’s the interpretive layer, not the measurement.
Why the distinction matters for client work:
- Geogrid data is auditable. You can hand a client a spreadsheet and defend every number.
- Heatmap visuals are persuasive. Nobody wants to review 81 rows of a 9x9 grid in a client meeting.
- Confusing the two leads agencies to either overwhelm clients with numbers or oversimplify results into a pretty picture with nothing behind it.
Google’s own guidance on local ranking factors confirms why this distinction exists at all: relevance, distance, and prominence drive map-pack placement, and distance alone can shift a business from rank 2 to invisible within a few blocks.
How a Geogrid Scan Actually Works
Setting up a scan means choosing five variables, and each one changes your cost, resolution, and noise level.
- Center coordinate. Usually the client’s address, though for multi-location businesses you might center on a competitive hub instead.
- Grid size. Common options run from a few points in a small grid up to larger grids. More points mean finer resolution and a bigger credit spend.
- Spacing or radius. Determines how far apart grid points sit, from a few hundred feet for dense urban cores to a mile or more for suburban service areas.
- Zoom level. Controls how Google interprets the search context at each point, which affects which competitors even appear.
- Keyword list. Each keyword gets its own full grid pass, so five keywords on a 5x5 grid is 125 searches, not 25.
A 5x5 grid on a single keyword runs 25 localized searches, as noted in explainers on how geogrid scans work. Each search records a rank position or a “not found,” and those 25 values become your matrix.
Tighter grids catch hyperlocal volatility, like a business that ranks great two blocks north and disappears two blocks south. Looser grids move faster and cost fewer credits but can miss that kind of variance entirely.
Pro Tip: Run a high-resolution grid once at the start of an engagement to map the baseline, then drop to a lighter grid for weekly or biweekly tracking. Save the dense scans for before-and-after snapshots around major changes.
How Heatmaps Turn Grid Data Into a Picture
Once the geogrid scan finishes, the rendering engine maps each numeric rank to a color band, typically a gradient from green through yellow to red. Legend design matters more than most agencies realize. A legend that lumps rank 4 and rank 40 into the same “yellow” bucket tells a client almost nothing useful.
Developers building their own heatmap rendering deal with a handful of settings that shape how the final image reads:
- Dissipating controls whether color intensity shrinks as you zoom out.
- Gradient defines the color stops between low and high values.
- Radius sets how far each data point’s influence bleeds into neighboring pixels.
- MaxIntensity and opacity control saturation and transparency, both of which can make sparse data look denser than it actually is.
These options come straight from the HeatmapLayer documentation, and misconfiguring any one of them creates a visual that looks confident but misrepresents the underlying grid. A radius set too wide smooths over real gaps in coverage.
Here’s a wrinkle worth knowing before you build anything in-house: Google deprecated the Maps JavaScript API’s native HeatmapLayer in May 2025, with full removal scheduled for May 2026. Agencies relying on that native layer for custom dashboards need a migration plan, whether that’s custom rendering, server-side tiling, or switching to a third-party tool that already handles visualization independently of Google’s deprecated component.
Weighing Geogrid Data Against Heatmap Visuals
Neither format wins outright. Each one covers for the other’s blind spot.
Geogrid advantages:
- Every number is auditable and defensible in a client dispute.
- Cell-level detail lets you troubleshoot exactly where a business loses visibility.
- Supports real metrics: coverage percentage, median rank, count of top-3 cells.
Geogrid drawbacks:
- A 9x9 grid across five keywords generates 405 data points. That’s heavy to process and expensive in scan credits.
- Raw tables mean nothing to a non-technical stakeholder without translation.
Heatmap advantages:
- Instant visual read. A client glances at red patches on a map and understands the problem without a spreadsheet walkthrough.
- Great for spotting geographic patterns, like a competitor dominating one neighborhood while your client owns another.
Heatmap drawbacks:
- Color smoothing hides granular detail. Two cells that are both “yellow” might be rank 5 and rank 15, which is a meaningful gap a client never sees.
- Without a clear legend and raw numbers alongside it, heatmaps invite misreadings.
Pro Tip: Pair every heatmap you deliver with the CSV export behind it. Executives look at the map. Whoever reports to them, or questions your invoice, looks at the numbers.
When to Run a Geogrid, When to Show a Heatmap
Match the format to the job, not the other way around.
- Audits and troubleshooting. Run a dense grid, 7x7 or finer, and pull the CSV directly into a spreadsheet for cell-by-cell analysis. This is where you find out a client ranks fine downtown but vanishes three miles west.
- Client-facing summaries. Pair a heatmap visual with two or three headline metrics, coverage percentage and top-3 cell count usually land best. Skip the raw grid unless someone asks.
- Ongoing campaign tracking. Schedule lighter grids (5x5) on a weekly or biweekly cadence for trend lines, then run a higher-resolution snapshot immediately before and after any major campaign change.
For default presets, a 5x5 grid handles most neighborhood-level audits well, while a 9x9 grid suits city-wide coverage checks for multi-location clients. Scan frequency depends on how aggressively you’re testing changes: monthly for stable accounts, weekly during active optimization pushes. Budget accordingly, since resolution and frequency both draw down scan credits fast on larger accounts.
Turning Grid Data Into Reports Clients Actually Trust
A grid scanning tool can cover this whole workflow without forcing agencies to stitch together separate tools for data collection and visualization. Scans can be customizable, ranging from a tight 3x3 spot-check to a sprawling 9x9 territory map, and may not require connecting a client’s Google account. That matters when you’re managing dozens of client profiles and don’t want twenty separate login headaches.
Reports can be white-labeled on the agency’s domain, so clients see the agency’s brand rather than a third-party tool’s watermark. Some tools include unlimited businesses on every plan, meaning adding a new client account does not trigger a new line item. Agencies typically use this setup to show before-and-after delta maps after a listing optimization push, pairing the visual with the coverage percentage shift underneath it, since a picture with a number attached is what actually survives a client budget review.

What Executives See vs. What Auditors Need
Show clients the heatmap. Keep the geogrid CSV on hand for anyone who questions the numbers. Distance-driven ranking volatility means a single-address rank check tells you almost nothing about how a business performs across its real service area, and reporting one number as “the ranking” sets up a conversation you’ll regret. Report coverage percentage and median rank monthly, and tie any grid shift directly to whatever action caused it, a new listing photo, a review response, a citation fix. Vague improvement claims don’t survive scrutiny. Specific, dated changes do.
— Local
Get Grid Data and Client-Ready Heatmaps Without the Per-Location Fees
Maprank is the alternative to juggling a separate rank checker, a spreadsheet, and a design tool just to produce one client report. Everything runs through customizable scan grids with white-label output on your own domain, no Google account integration required, and unlimited businesses included on every plan, so your pricing doesn’t punish you for landing new clients.
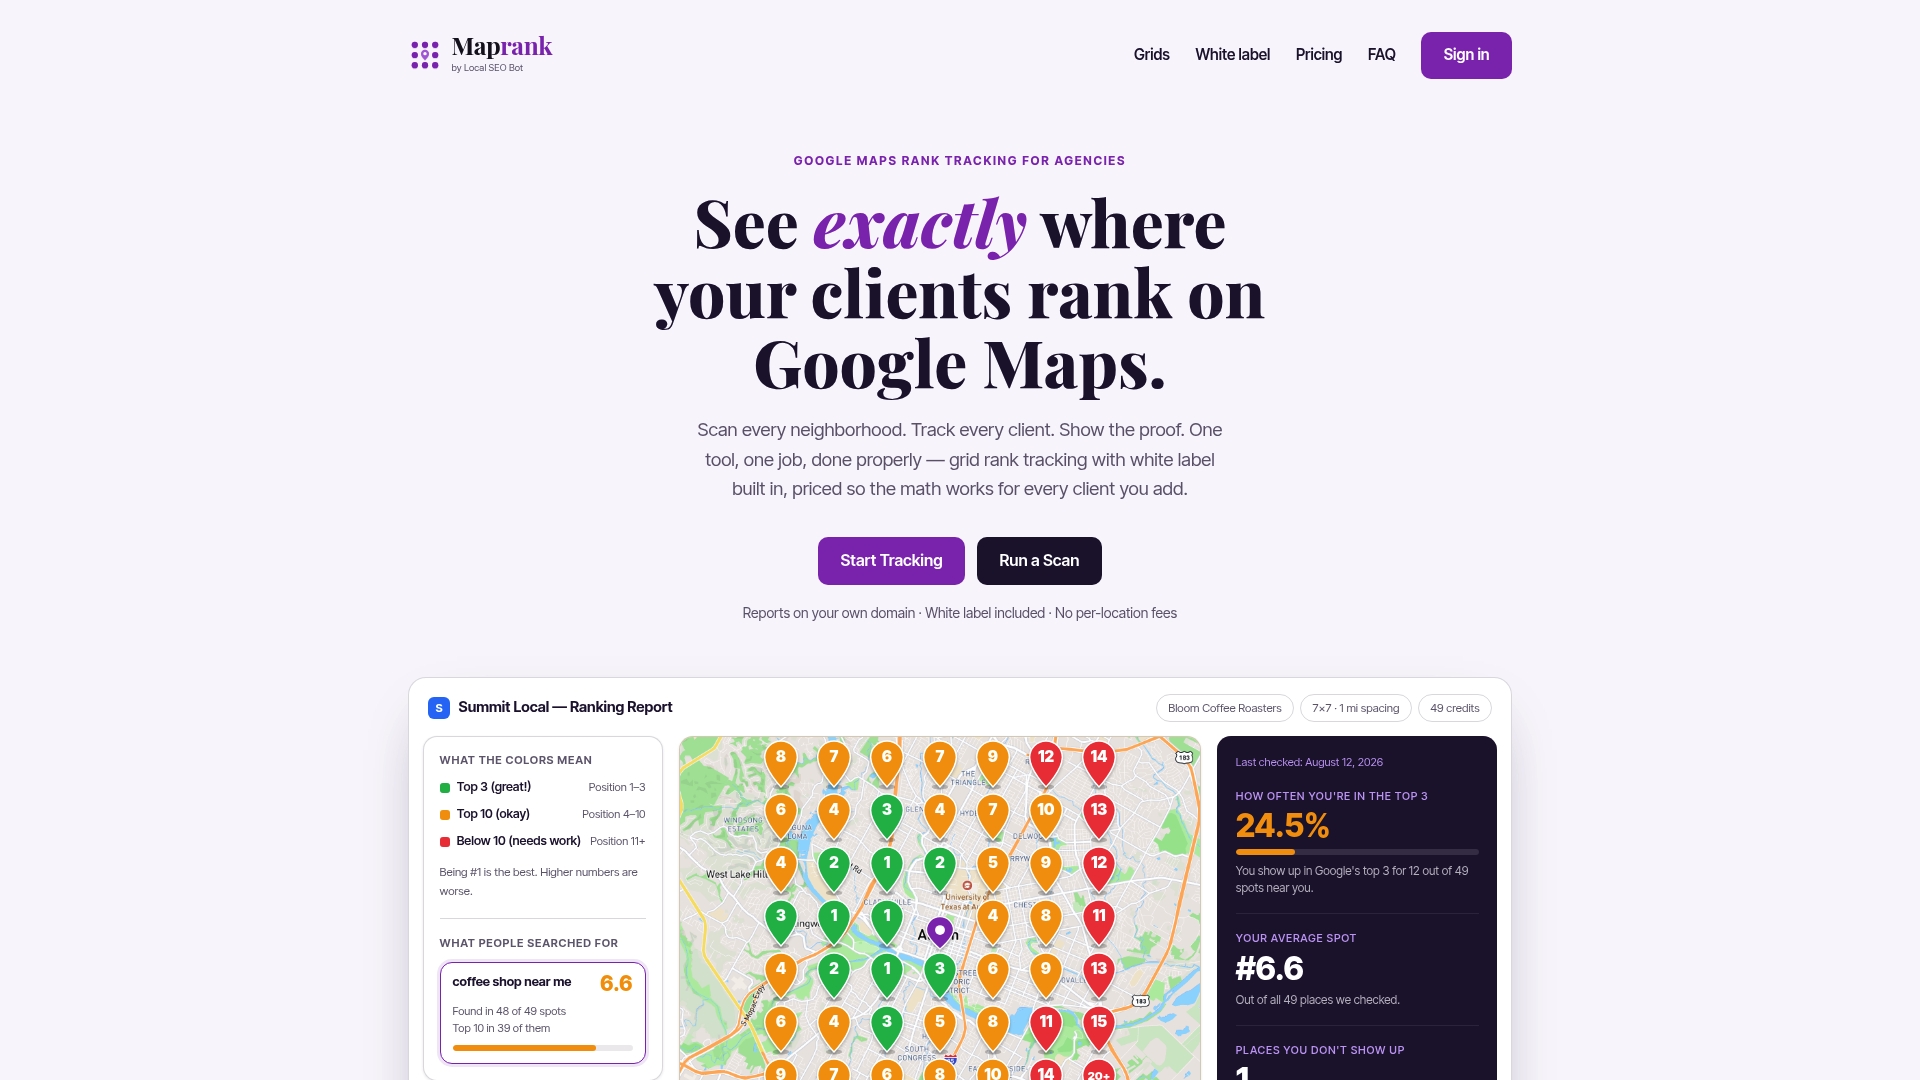
If you want to see what a scan actually looks like before committing to anything, start with a one-off rank check on a live client address. For agencies ready to run this across a full book of business, compare plans and grid options at Maprank and pick the tier that matches your scan volume.
Sources
Google’s own guidance on local ranking factors explains the relevance, distance, and prominence signals behind every geogrid result. Developers building custom visualizations should review the HeatmapLayer deprecation notice before investing in native Maps API rendering. For a deeper technical breakdown of grid mechanics, the geogrid explainer at Local SEO Data walks through scan math in more detail. Agencies weighing geo-rank data against conversion data may also find value in server-side tracking methods for connecting rank movement to actual leads.
- Tips to improve your local ranking on Google - Google Business Profile Help
- HeatmapLayer — Maps JavaScript API
FAQ
What Is Another Name for a Heatmap?
Heatmaps are sometimes called intensity maps or density maps, since the color gradient represents the concentration or intensity of a value across a geographic area. In local SEO specifically, some tools label the same output a “ranking map” or “visibility map.”
What Are the Disadvantages of Heat Maps?
Heatmaps smooth data through gradients, which can hide meaningful gaps between two nearby scores that end up the same color. Sparse data or a poorly chosen radius setting in tools built on the HeatmapLayer can also make thin coverage look denser than it really is, misleading anyone reading the visual without the raw numbers behind it.
Why Is It Called a Heatmap?
The name comes from the color convention borrowed from thermal imaging, where red or orange represents higher values and blue or green represents lower ones. In local rank tracking, that same convention flips depending on the tool, so always check the legend before assuming red means “bad.”
Can ChatGPT Create Heatmaps?
ChatGPT can generate code or describe how to build a heatmap using mapping libraries, but it can’t run a live geogrid scan or pull real-time Google Maps ranking data on its own. Actual ranking heatmaps require a scanning tool, like Maprank’s grid tracker, that queries Google directly from multiple coordinates and renders the results.
How Much Does Grid-Based Rank Tracking Cost?
Maprank’s plans start at $19 per month for Maprank Solo, scaling up through Agency, Pro, and Scale tiers based on scan credits, seats, and grid size. Many tiers include white-label reporting and unlimited businesses, so costs scale with scan volume rather than the number of client accounts managed.