Grid Rank Tracking: How It Works and How to Pick Grid Size
Grid Rank Tracking: How It Works and How to Pick Grid Size

Grid rank tracking checks a business’s Google Maps ranking from many points laid out across an area, not from one address. You get a map of where the business shows up in the top spots and where it disappears. The two settings that shape that map most are grid size (how far the scan reaches) and grid density (how many points sit inside that reach). Get them right and the scan matches how customers actually search. Get them wrong and it can flatter a weak listing or hide a strong one.
TL;DR
- A grid scan runs the same Google Maps search from a pattern of points, then records the business’s rank at each one. The result is a map, not a single number.
- Set the radius from the business’s real customer or service area. Set the spacing from how dense that area is: tighter in a city, wider in the suburbs or countryside.
- More points means finer detail and a higher cost per scan. Choose the smallest grid that answers your question.
- Keep radius, spacing and keyword fixed when comparing one scan with the next. Otherwise you are comparing two different measurements.
- Summary metrics such as average rank and share of local voice make good report headlines. The map shows what to fix.
Table of Contents
- What grid rank tracking is
- The two settings that matter: grid size and density
- How to choose a grid size for a service area
- How density changes what you see
- How to read the results
- How often to scan
- Our perspective
- Choosing a tool for grid rank tracking
- Try it on a client
- A simple setup you can copy
- Common mistakes with grid settings
- FAQ
- Sources
What grid rank tracking is
Local results on Google Maps change with the searcher’s location. Someone standing three blocks from a dentist sees a different list than someone searching from the other side of town. A single-location rank check collapses that into one number, which is rarely true anywhere except the spot where the check ran.
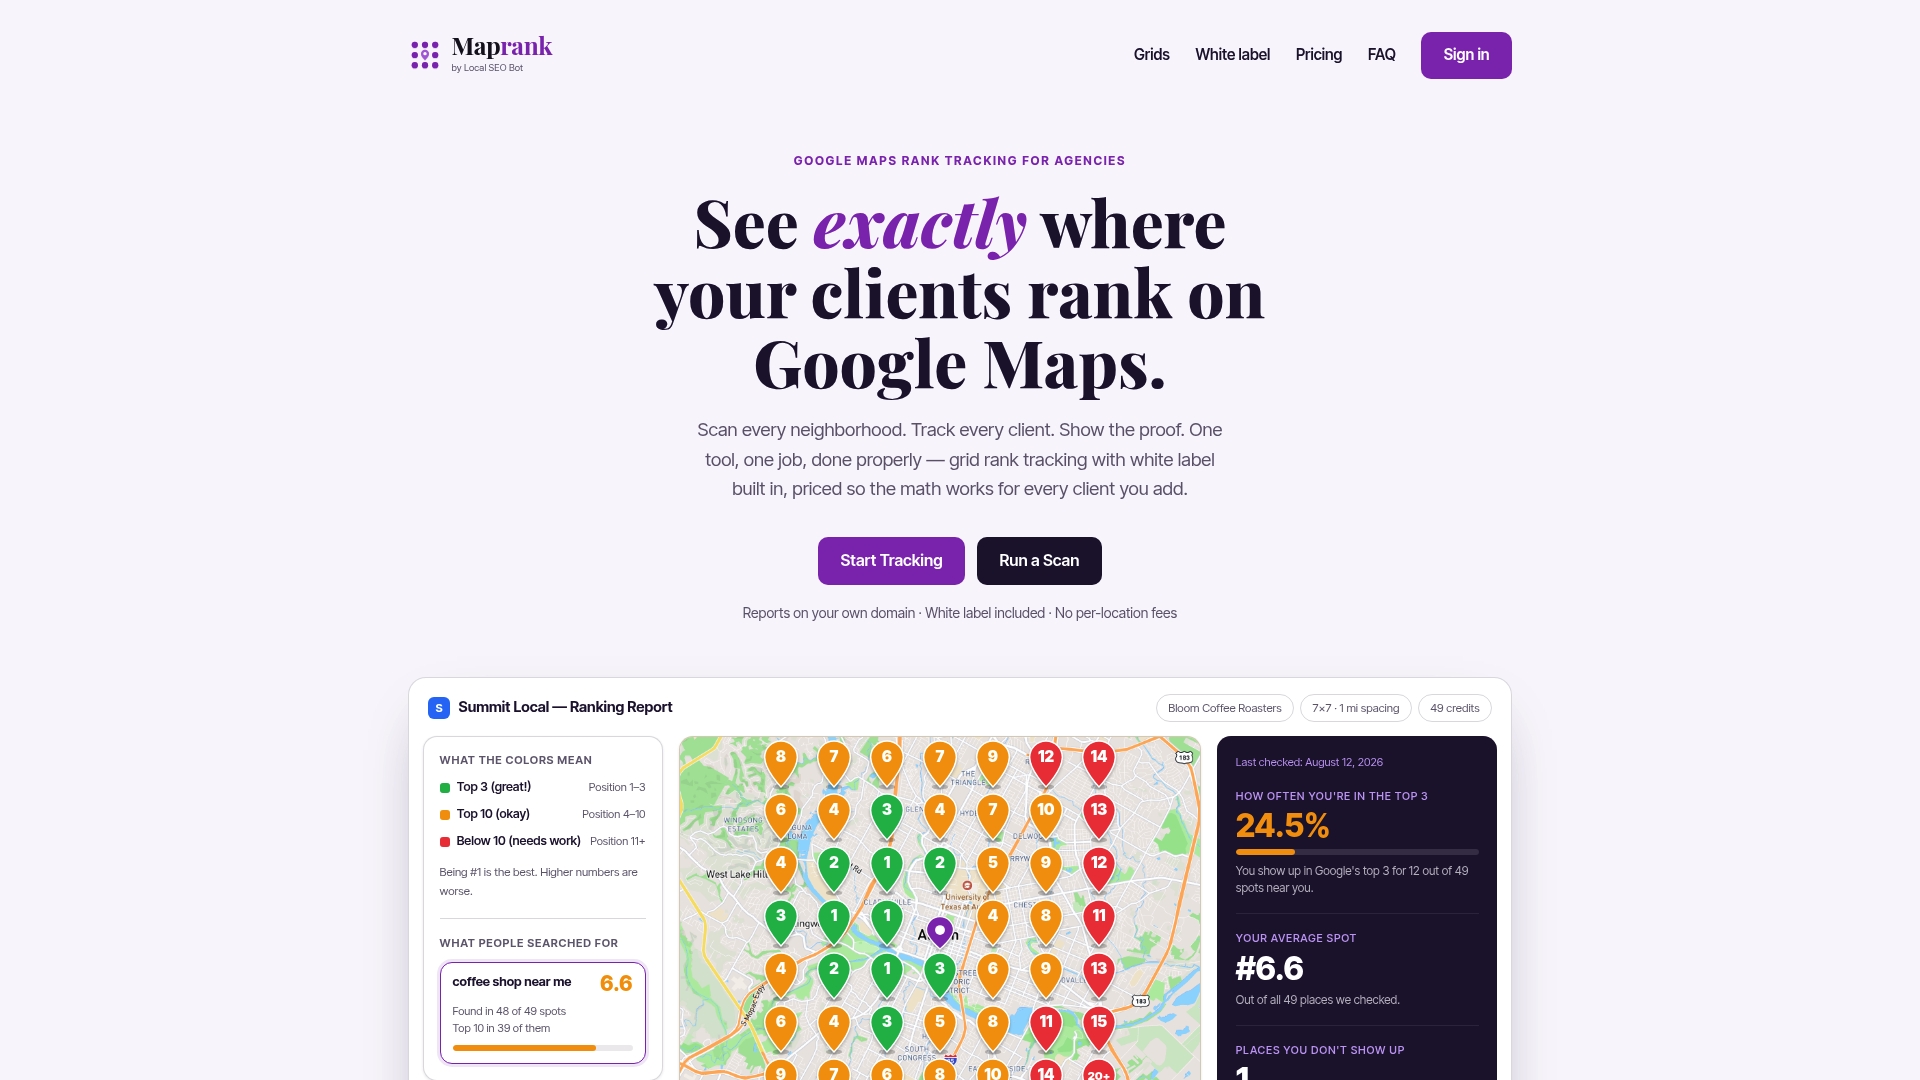
Grid rank tracking fixes this by placing a set of points over a map, centered on the business or on the area you care about. For each point, the tool searches the same keyword as if the searcher were standing there, then records where the business appears. You usually see the result as colored pins or a heat map: green near the top, then yellow and orange as rank slips, then red or gray where the business is not found.
You may see it called geo-grid tracking, local rank grid scanning or map pack heat mapping. They are the same idea.
Why one rank number misleads
Google says local results are based mainly on relevance, distance and prominence, as confirmed in its Business Profile help. Distance is the factor a grid exposes. A business can be first at its own front door and invisible two miles away, even though its relevance and prominence have not changed.
That is why a grid gives a better picture than a rank checked from the business’s address. It shows the shape of visibility: strong at the center, fading toward the edges, with holes in places you would not guess.
What a scan tells you that a rank check cannot
- Coverage: the share of your service area where customers can find you.
- Direction of weakness: whether you fade to the north, along a highway or near a competitor’s location.
- Competitor footprint: where another business holds the top spots you want.
- Change over time: whether your optimization work moved the map or only moved the center.
The two settings that matter: grid size and density
People search for “rank grid size”, “geo grid size” and “grid density” as if they were one thing. They are two separate decisions.
Grid size (or radius) is how far the scan reaches from the center. A 3-mile radius measures a neighborhood. A 15-mile radius measures a metro area.

Grid density is how many points fill that radius and how far apart they sit. A 5x5 grid places 5 points per side. A 13x13 grid places 13. Over the same radius, the larger grid has tighter spacing.
In a square grid, the point count is the side length squared, so a 3x3 scan has 9 points, a 5x5 has 25 and a 9x9 has 81. Point count grows fast, and so does the cost of each scan, since each point is a search.
| Setting | What it controls | Too small | Too large |
|---|---|---|---|
| Radius | How far from the center you measure | Misses places customers come from | Fills the map with areas you do not serve |
| Spacing | Distance between points | Wastes scans on points that say the same thing | Skips over pockets where rank changes |
| Point count | Detail and scan cost | Rough picture | Costly, with little new information |
How to choose a grid size for a service area
Start from the business, not the tool’s default. Localogy reported that grid size and spacing should reflect how far customers actually travel, with dense urban businesses needing tighter sampling over a smaller area and suburban or rural ones needing wider coverage. A universal default can misrepresent performance, because every business draws from a different catchment.
Here is a practical way to set it.
- Define the real catchment. Look at where current customers live, which zip codes the business serves and how far a typical job or visit goes. A plumber who drives 20 miles has a different catchment than a coffee shop whose customers walk.
- Set the radius to cover that catchment. Reach to the edge of the service area and a little past it, so you see where visibility ends.
- Pick the spacing for the terrain. Dense cities have many different neighborhoods in a short distance, so use tight spacing. A rural county does not change that quickly, so wider spacing is enough.
- Start with the smallest grid that answers the question. If you need to know whether a business is visible across its home neighborhood, you do not need a metro-sized scan.
- Lock the settings. Once you choose, keep them for reporting.
Starting points by business type
These are working defaults, not rules. Google does not publish a standard scan radius, so adjust to the client.
| Business | Typical approach | Why |
|---|---|---|
| Restaurant, café, salon in a dense city | Small radius, tight spacing | Customers choose by proximity, and rank shifts block to block |
| Dentist or clinic in a mid-size city | Medium radius, medium spacing | Patients travel across town but not far beyond it |
| Home services (plumber, HVAC, roofer) | Large radius, wider spacing | Service area is defined by drive time, not walking distance |
| Rural or regional business | Largest radius, widest spacing | Customers come from several towns |
| Multi-location brand | Separate grid per location | Catchments overlap and differ by site |
For multi-location clients, build one grid around each location rather than one large grid covering all of them. Otherwise one strong branch can hide a weak one.
How density changes what you see
Density decides how much of the picture you get for each scan.
Low density (a 3x3 or 5x5 grid) is quick and cheap. It is good for a first look, for routine monitoring of stable clients and for large rural areas where rank changes slowly. The risk is that it can step over a small pocket of low rank.
Medium density (about 7x7 to 9x9) is where most agency work lands. It is detailed enough to show neighborhoods and clusters without a large scan bill.
High density (11x11 and up) is for dense urban areas, for a single neighborhood where you need block-level detail, or for diagnosing a specific drop. It costs more per scan, so use it deliberately, not as the default for every client.

A useful rule: raise density only when the map is giving you a decision you cannot make. If a 7x7 grid already shows the north side is red, a 15x15 grid will draw the same red area in more detail but will not change what you do.
Radius and density together
The two settings interact. Doubling the radius without adding points doubles the spacing between points, so detail drops. To keep the same detail over a wider area, you need more points. That is the trade-off behind every grid choice: reach, detail and cost, and you pick two priorities.
When a client wants “the whole city”, it is often better to run one wider, coarser scan for the big picture, then a tighter one on the neighborhoods that look weak.
How to read the results
The map is the main output, but most tools also condense it into summary numbers. Two are common:
- Average grid rank (AGR): the mean rank across all grid points, with points where the business does not appear counted at a fixed cap (often 20), according to one local SEO guide. Lower is better.
- Share of local voice (SoLV): the percentage of points where the business shows in the top 3, or in some tools the top 10. Higher is better.
Because definitions differ between tools, check how yours calculates each before you compare numbers across platforms.
What to look for on the map
- A strong core with a fast fade: the business ranks well near its address and loses visibility as distance grows. Work on prominence signals, such as reviews and local links, and on category and service-area accuracy.
- Holes inside the service area: a pocket of red surrounded by green often points to a competitor located there. Look at who holds the top three in that pocket.
- Strength in the wrong place: good rank in areas the business does not serve, and weak rank where it does. Check the service area, categories and keyword choice.
- Uniform weakness: low rank everywhere suggests a relevance or prominence issue, not a distance one.
Turning the map into client action
A report that says “average rank improved from 9.4 to 6.1” is nice. A report that says “we now show in the top three in the eastern suburbs where we were absent, and next we are targeting the north side” is the one that keeps a retainer. Pair every map with one finding and one next step.
How often to scan
There is no official scanning schedule, so match frequency to what you are doing.
- Routine monitoring: weekly or every two weeks is enough for most clients. Local rank moves slowly outside of changes you make.
- After a major change: run a fresh scan soon after a significant optimization, such as a category change, a new landing page or a Business Profile overhaul. One practitioner guide suggests within 48 hours to get a clean before-and-after point.
- Before and after campaigns: take a baseline before work begins so you can show the change.
Why scans differ from each other even without changes: Google’s results vary with the searcher’s position, time of day, device and personalization, and competitors change their profiles and reviews all the time. Small movements between two scans are noise. Look for patterns across several scans before reporting a trend, and never change the grid settings between the scans you are comparing.
Our perspective
We built Maprank because grid rank tracking should be a way to show clients their visibility, not a pricing puzzle for the agency.
Most tools charge in ways that punish growth: fees per location, extra cost for each added business, and white labeling locked in a higher tier. That pushes agencies to track fewer clients, or to choose a grid size by what they can afford instead of what the client needs. We think grid choice should come from the client’s service area and nothing else.
So every Maprank plan includes unlimited businesses and white label reporting on your own domain, and you pay in scan credits that you decide how to spend. Want a tight grid on a city-center restaurant and a wide one on a rural contractor? You can set both without asking whether the client is worth the extra location fee. Our scans also require no Google account connection, so onboarding a new client means entering a business, not chasing access.
The best grid is the one that matches the customer’s reach, stays the same from one scan to the next and ends up in a report the client understands. That is what we designed the tool to do.
Local
Choosing a tool for grid rank tracking
Whatever you use, check these points against your own client list:
- Customizable radius and spacing, so each client gets a grid that fits its service area.
- Pricing that does not scale with every business you add, so you can track the whole roster.
- White label reports on your domain, so the client sees your brand.
- No Google account connections, so you can start without client access.
- Clear scan cost, so you can budget a grid before you run it.
If you want to see how the approach works in practice, our guides on grid-based Google Maps rank tracking and on scanning your rankings across a service area go deeper. For agencies handling many accounts, there is also a walkthrough on scaling local SEO reporting.
Try it on a client
Maprank is a grid-based Google Maps rank tracker for agencies, consultants and freelancers. Every plan includes unlimited businesses, white label reporting on your own domain and customizable grids. Plans start at $19 per month for Solo, with Agency at $39 per month, Pro at $79 per month and Scale at $149 per month. Annual billing is $228, $468, $948 and $1,788 per year respectively. Pricing scales by scan credits, seats and grid size. See the plans on our site, or run a one-off rank check first.
A simple setup you can copy
Here is a worked example of how the settings fit together for three imaginary clients.
A downtown coffee shop. Customers walk or take a short ride. A small radius with tight spacing shows block-by-block differences. The question is whether the shop appears for “coffee near me” in the surrounding blocks, and where a rival chain outranks it.
A suburban dental practice. Patients drive 10 to 15 minutes. A medium radius with medium density covers the towns patients come from. Run it on a weekly or biweekly schedule, with an extra scan after profile changes.
A rural roofing company. The service area spans several towns. A large radius with wide spacing gives a regional view at a sensible cost. If one town looks weak, run a tighter scan only there.
In each case the order is the same: define the catchment, set the radius, choose the spacing, lock the settings, scan on a schedule and report one finding with one next step.
Common mistakes with grid settings
- Using one default grid for every client. It fits some and misleads on others.
- Making the grid too big. Wide scans that include places the client does not serve pull your average rank down and confuse the report.
- Making the grid too sparse. A coarse grid can step over small low-rank pockets.
- Changing settings between scans. You can no longer say whether rank moved or the measurement did.
- Tracking one keyword. A business usually has several service terms, and each draws a different map. Track the ones that bring revenue.
- Reporting average rank alone. A single number hides the geography that tells the client what to do.
FAQ
What is grid rank tracking?
Grid rank tracking runs the same Google Maps search from many points across an area and records where a business ranks at each point. The result is a heat map of visibility instead of a single rank. It shows which neighborhoods the business wins and which it misses.
What grid size should I use for a local business?
Base it on where the business’s customers come from. Use a smaller radius with tight spacing for dense cities and a larger radius with wider spacing for suburban or rural areas. Start with the smallest grid that answers your question, then keep it fixed.
Does a bigger grid give better data?
Not automatically. A bigger radius covers more ground, and more points add detail, but both raise scan cost. If the extra area is outside the service area, or the extra detail does not change your next step, the larger grid adds cost without insight.
How often should I run a grid scan?
Weekly or every two weeks suits routine monitoring for most clients. Add a scan shortly after any major optimization so you have a clean before-and-after comparison. Always use identical settings when comparing scans.
Why does my rank change between two scans?
Google’s local results vary with the searcher’s location and context, and competitors update their profiles and reviews constantly. Small shifts are normal. Judge trends across several scans with unchanged settings.
Sources
- Are Relevance, Distance, & Prominence Google Ranking Factors? (Search Engine Journal)
- Why Multi-Location Businesses Need Custom Geo-Grid Rank Tracking (Localogy)
- What Is Geo-Grid Rank Tracking? (Searchscope)
- How to Track Google Maps Rankings Accurately (Wiremo)