Local Rank Reporting Metrics for Agencies: ATRP and SoLV Expose Gaps
Local Rank Reporting Metrics for Agencies: ATRP and SoLV Expose Gaps

The single best health indicator for local rank reporting is Average True Rank Position (ATRP), because it accounts for every grid point in a scan rather than only the ones where a business shows up. Pair it with Share of Local Voice (SoLV), Average Rank Position (ARP), Found In percentage, Google Business Profile interactions, and call or lead conversions, and you have a reporting set that ties visibility to outcomes clients actually care about instead of a single vanity rank.
TL;DR:
- ATRP counts every grid point, including absences, while ARP averages only visible positions; pair Found In with either to separate coverage from ranking strength.
- When ARP improves while SoLV falls, the business ranks better where it appears but loses ground elsewhere; check competitor growth and keep grid settings consistent.
- Service area businesses should compare SoLV Distance with their advertised radius; a drop at six miles within a 15 mile service area reveals underserved territory.
- If grid metrics stay stable while Google Business Profile interactions fall, inspect listing hours, photos, and review responses before changing ranking work.
- Use monthly reports for calls, Google Business Profile interactions, and near term rank movement, then review SoLV trends and competitor positioning quarterly.
Table of Contents
- 1. Core local rank reporting metrics explained
- 2. Grid metrics explained: ARP, ATRP, SoLV, and distance
- 3. Metric interaction patterns and what they actually mean
- 4. Report templates, dashboards, and reporting cadence
- 6. Agency workflow: turning grid scans into client value
- 7. Strategies to identify market gaps using local rank data
- 8. How to handle multi-location or multi-business reporting efficiently
- 9. Benchmarking local rank metrics against competitors and industry standards
- 10. First-person agency perspective: reporting habits that win retention
- Maprank: agency-focused grid tracking and white-label reporting
- FAQ
- Sources
1. Core local rank reporting metrics explained
Every metric in a local rank report answers a different question, and agencies that mix them up end explaining confusing numbers instead of telling a clear story. Start with the grid basics.
ARP (Average Rank Position) measures the average position a business holds, counted only at the grid points where it actually appears in results. If a plumbing company ranks 3rd, 5th, and 7th across three points where it shows up, its ARP is 5. ARP is useful for judging how well a business performs where it already has visibility, but it says nothing about the points where it is invisible, which is where ATRP comes in.
ATRP (Average True Rank Position) averages rank across every point in the scan grid, assigning a default low position to any point where the business does not appear at all. This makes ATRP the more honest overall visibility score, since a business that ranks 1st in five points but is absent everywhere else can still have a poor ATRP that reflects its real market presence according to grid-based metric definitions.
Found In is the percentage of grid points where the business appears anywhere in the results at all, regardless of position. A business with a high Found In but a weak ARP shows up everywhere but rarely near the top, which points to a different fix than a business with a low Found In across the board.
SoLV (Share of Local Voice) measures the percentage of grid points where a business holds a top-3 map pack position, functioning as a market-share metric rather than a rank average.
Beyond the grid, Google Business Profile interactions round out the picture: profile views, direct and discovery searches, direction requests, phone calls, and website clicks. These numbers show what happens after a searcher finds the business, which grid metrics alone cannot capture.
- ARP: average position where the business already ranks, best for judging quality of existing visibility.
- ATRP: average position across the full grid including absences, best as the single overall health score.
- Found In: percentage of points where the business appears at all, best for coverage questions.
- SoLV: percentage of points with top-3 presence, best for market-share conversations with clients.
- GBP interactions: views, searches, calls, and clicks, best for connecting visibility to business activity.
Organic traffic and GA4 session data still matter, but for a client whose business depends on map pack visibility and phone calls rather than website conversions, these metrics belong in a secondary section rather than the headline. According to Search Engine Land’s guide to local SEO metrics, local performance is best reported as a cluster of indicators tied to business goals, not a single ranking number.
Which metric should lead the report depends on what the client actually wants. A client focused on expanding into new neighborhoods cares most about Found In and SoLV growth. A client worried about losing ground to a specific competitor wants ATRP trends. A client who only cares about the phone ringing wants GBP calls and website clicks front and center, with SoLV as supporting evidence that the visibility behind those calls is real.
2. Grid metrics explained: ARP, ATRP, SoLV, and distance
Grid rank tracking scans a business’s visibility across a set of geographic points rather than from a single address, which is what makes metrics like ARP and ATRP possible in the first place.
To calculate ARP, average the rank values only at points where the business appears. A business showing up at positions 2, 4, and 6 across three visible points has an ARP of 4, full stop, regardless of how many other points in the grid returned nothing for that business.
To calculate ATRP, include every point in the grid, assigning a worst-case or default position to points with no appearance, then average across the entire set. This is why ATRP is described as the most comprehensive single metric for overall visibility health: it penalizes invisibility the same way a client’s lost customers would, according to the metrics-interpretation reference.
Found In should always be read alongside ARP or ATRP rather than alone.
SoLV comes with several useful variants:
- SoLV: current percentage of grid points with top-3 presence.
- Competition SoLV: the top-3 share held by the strongest competitor, useful for direct comparison.
- Max SoLV: the highest SoLV any single business holds across the grid, a ceiling reference.
- Opportunity SoLV: the gap between current SoLV and a realistic improved state, useful for pitching work.
Statistic callout: In highly competitive urban markets, a SoLV above 50% across a full grid often marks a business among the stronger local performers, according to the local-falcon metrics reference; in less competitive or rural grids, a similar SoLV can reflect weaker underlying competition rather than exceptional optimization.
SoLV Distance, sometimes shown as Average SoLV Distance, measures how far from the business’s physical location its top-3 presence extends. This matters most for service-area businesses that travel to customers, since a business can have a strong SoLV near its address but drop off sharply a few miles out, a gap that a single-point rank check would never reveal.
A few quick checks prevent common misreads. A rising ARP alongside a falling SoLV usually means the business is doing better where it already ranked but losing ground elsewhere in the grid, which a glance at ARP alone would miss entirely. Comparing grids of different sizes or spacing across reporting periods will also produce misleading trend lines, so lock the grid configuration before tracking change over time.
3. Metric interaction patterns and what they actually mean
Reading metrics in combination, rather than one at a time, is what turns a rank report into a diagnosis.
- High Found In, high ATRP, low SoLV: the business shows up broadly but rarely cracks the top 3, which usually points to proximity limits or stronger-authority competitors occupying the map pack; prioritize review velocity and category optimization over basic visibility fixes.
- Low Found In, low ARP: the business is both invisible across much of the grid and weak where it does appear, often a sign of thin Google Business Profile content, missing categories, or citation gaps that need foundational cleanup first.
- Declining SoLV with improving ARP: the business is ranking better where it already had presence but losing ground elsewhere, frequently caused by a new competitor entering the market or expanding their own service area.
- Strong SoLV near the business address but a sharp SoLV Distance drop-off: visibility is real but geographically shallow, a signal to build location-specific content or service-area pages rather than more generic optimization.
- Stable grid metrics but falling GBP interactions: the ranking is intact but something in the listing itself, such as outdated hours, photos, or review responses, is costing conversions even though visibility hasn’t changed.
Pro Tip: Run the Found In and ATRP numbers together before touching anything else: they tell you whether the problem is invisibility or weak positioning, and that distinction changes which fix comes first.
Triage matters as much as diagnosis. Google Business Profile edits, photo updates, and category corrections are quick wins that can show movement within weeks. Review acquisition and citation cleanup take longer but compound over months. Building topical authority through on-page content and earning backlinks is the strategic work that underlies sustained ATRP and SoLV gains, and it should be flagged to clients as a multi-quarter investment rather than a quick fix.
4. Report templates, dashboards, and reporting cadence
A report that opens with a wall of grid data loses most clients before they reach the recommendation. Structure matters more than volume.
The executive summary should fit on one page: a single-sentence health verdict built on the primary metric (ATRP or SoLV depending on the client’s goal), three supporting metrics, and one clear recommendation. A client should be able to read it in under a minute and know whether things are improving.
The technical appendix is where the detail lives: grid heatmaps showing SoLV by location, an ATRP trend line over the reporting period, a Found In table broken out by keyword or location, GBP interaction totals, and conversion tracking tied to calls or form fills. This is where account managers and more technical client contacts dig in.
Cadence depends on the audience. Monthly reports work best for operational tracking: GBP interactions, call volume, and short-term rank movement. Quarterly reports suit strategic planning: SoLV trend over the quarter, Opportunity SoLV against competitors, and a review of which fixes from the triage list actually moved the needle.
- Executive summaries stay to one page with a single health verdict and one recommendation.
- Technical appendices carry heatmaps, trend lines, and raw tables for deeper review.
- Monthly cadence suits operational metrics like calls and short-term rank shifts.
- Quarterly cadence suits strategic metrics like SoLV trend and competitive positioning.
- Visualizations should match the metric: maps for SoLV, line charts for ATRP and ARP, overlay charts for conversions against visibility.
Our guide to grid scanning across a service area covers how to visualize grid data effectively for client-facing reports.
Different client types need different KPI emphasis:
| Client type | Lead metric | Supporting metrics |
|---|---|---|
| Service-area trades (plumbing, HVAC) | SoLV Distance | ATRP, GBP calls, direction requests |
| Multi-location retailers | ATRP by location | Found In variance across locations, GBP searches |
| Professional services (legal, dental) | SoLV | ARP, website clicks, booking conversions |
Conversion overlays, where a call-volume line sits on top of an ATRP or SoLV trend line, do more to justify a retainer than any single rank number, because they show the client the connection between visibility and revenue rather than asking them to take it on faith.
6. Agency workflow: turning grid scans into client value
Running a grid scan is only the first step. The value for an agency comes from turning that raw output into something a client opens, understands, and renews a contract around.
A typical workflow moves from scan to deliverable without much manual work: schedule recurring grid scans, export heatmaps and trend tables automatically, and drop them into a white-labeled report that carries the agency’s own branding rather than the tool’s. Running scans through Maprank fits this workflow directly, since white-label reporting on the agency’s own domain, customizable scan grids, and unlimited businesses are available on every plan, with credit-based pricing that does not add extra fees per client account.
Before a client review meeting, a simple checklist helps: confirm the grid configuration matches the prior period, export the current SoLV heatmap and ATRP trend, flag any pattern from the diagnostic list above, and prepare one recommendation tied to the biggest movement in the data.
- Schedule grid scans on a fixed cadence so trend data stays comparable period to period.
- Export heatmaps and trend charts automatically rather than rebuilding them manually each cycle.
- White-label every client-facing export so reports reinforce the agency’s brand, not the tool’s.
- Review the diagnostic patterns before each client meeting so the recommendation is ready in advance.
Our piece on winning clients with better reporting walks through this workflow in more detail for agencies building out their reporting process.
7. Strategies to identify market gaps using local rank data
Grid data is one of the few tools that shows exactly where a business is losing ground geographically, not just whether it ranks well on average. Overlay the SoLV heatmap against a map of the service area and look for clusters of low-SoLV points that sit close to the business location: that pattern usually signals a proximity or content gap rather than a true competitive loss.

Comparing Opportunity SoLV across neighborhoods highlights where the ceiling for improvement is highest. A zone with low current SoLV but a high Max SoLV held by a competitor means the ranking factors that would close the gap are achievable, since someone else is already achieving them in that same area.
Found In gaps matter too. A neighborhood where the business is entirely absent, rather than just ranking low, often means a missing service-area page or a citation gap specific to that location, which is a more targeted fix than a broad SEO campaign.
Checking SoLV Distance against the business’s actual service radius can also reveal underused territory: if the business markets to a 15-mile radius but SoLV drops off at 6 miles, that gap between marketed and actual reach is a concrete opportunity to prioritize in the next planning cycle. Our explainer on local rank grid scans covers how to set up a grid that captures this kind of territory accurately.
8. How to handle multi-location or multi-business reporting efficiently
Reporting on ten locations the same way you report on one quickly becomes unmanageable, so the structure needs to change before the account list grows.
Standardize the grid configuration across every location first: same grid size, same point spacing, same scan frequency. Without that consistency, comparing ATRP or SoLV between locations tells you more about measurement differences than actual performance differences.
A rollup table works better than ten separate reports for the executive layer: one row per location showing ATRP, SoLV, and Found In, with color-coded flags for locations trending down. Save the full heatmap detail for the technical appendix tied to each specific location, so a client managing a regional chain can scan the rollup in a minute and only dig into the location that needs attention.
Offering unlimited businesses on a single account removes the per-location fee structure that makes multi-location reporting expensive to scale with many traditional rank trackers. That matters operationally: an agency managing 15 locations for one client pays the same plan rate as one managing a single business, which keeps the reporting workflow economical as client rosters grow.
9. Benchmarking local rank metrics against competitors and industry standards
A SoLV or ATRP number means little without something to compare it against, which is why Competition SoLV and Max SoLV exist as grid metrics in the first place: they put the client’s own numbers next to the strongest performer in the same grid.
Industry-wide benchmarks are harder to pin down, since competitiveness varies enormously by market size and vertical, a legal practice in a major metro competes in a different environment than a single-location HVAC company in a small town. Rather than chasing a universal “good” SoLV number, benchmark against the client’s own historical trend first, then against named local competitors pulled directly from the same grid scan.
When a client asks whether a given SoLV or ATRP is good, the honest answer compares it to the toughest competitor visible in their own grid data rather than to an external industry average that may not reflect their specific market. Competition SoLV answers that question directly and ties the benchmark to data the client can see for themselves.
10. First-person agency perspective: reporting habits that win retention
The habit that changes retention fastest is leading every report with a market-share metric like SoLV instead of a raw rank number, then tying it to calls or form fills in the same paragraph. Clients renew when they see visibility connected to their phone ringing, not when they see a position number move from 4 to 3.
Avoid vanity metrics by explaining, briefly, why a number matters before showing it. Never declare success on a rank improvement alone: check the conversion data from the same period before telling a client the work is paying off.
— Local
Maprank: agency-focused grid tracking and white-label reporting
Everything covered above, SoLV heatmaps, ATRP trends, Found In tables, GBP interaction summaries, maps directly to what Maprank exports for client reporting. Grid scans are customizable in size and spacing, white-label reporting carries the agency’s own branding, and unlimited businesses are included on every plan rather than priced per location, with credit-based pricing that stays predictable as account rosters grow. No Google account integration is required to run a scan.
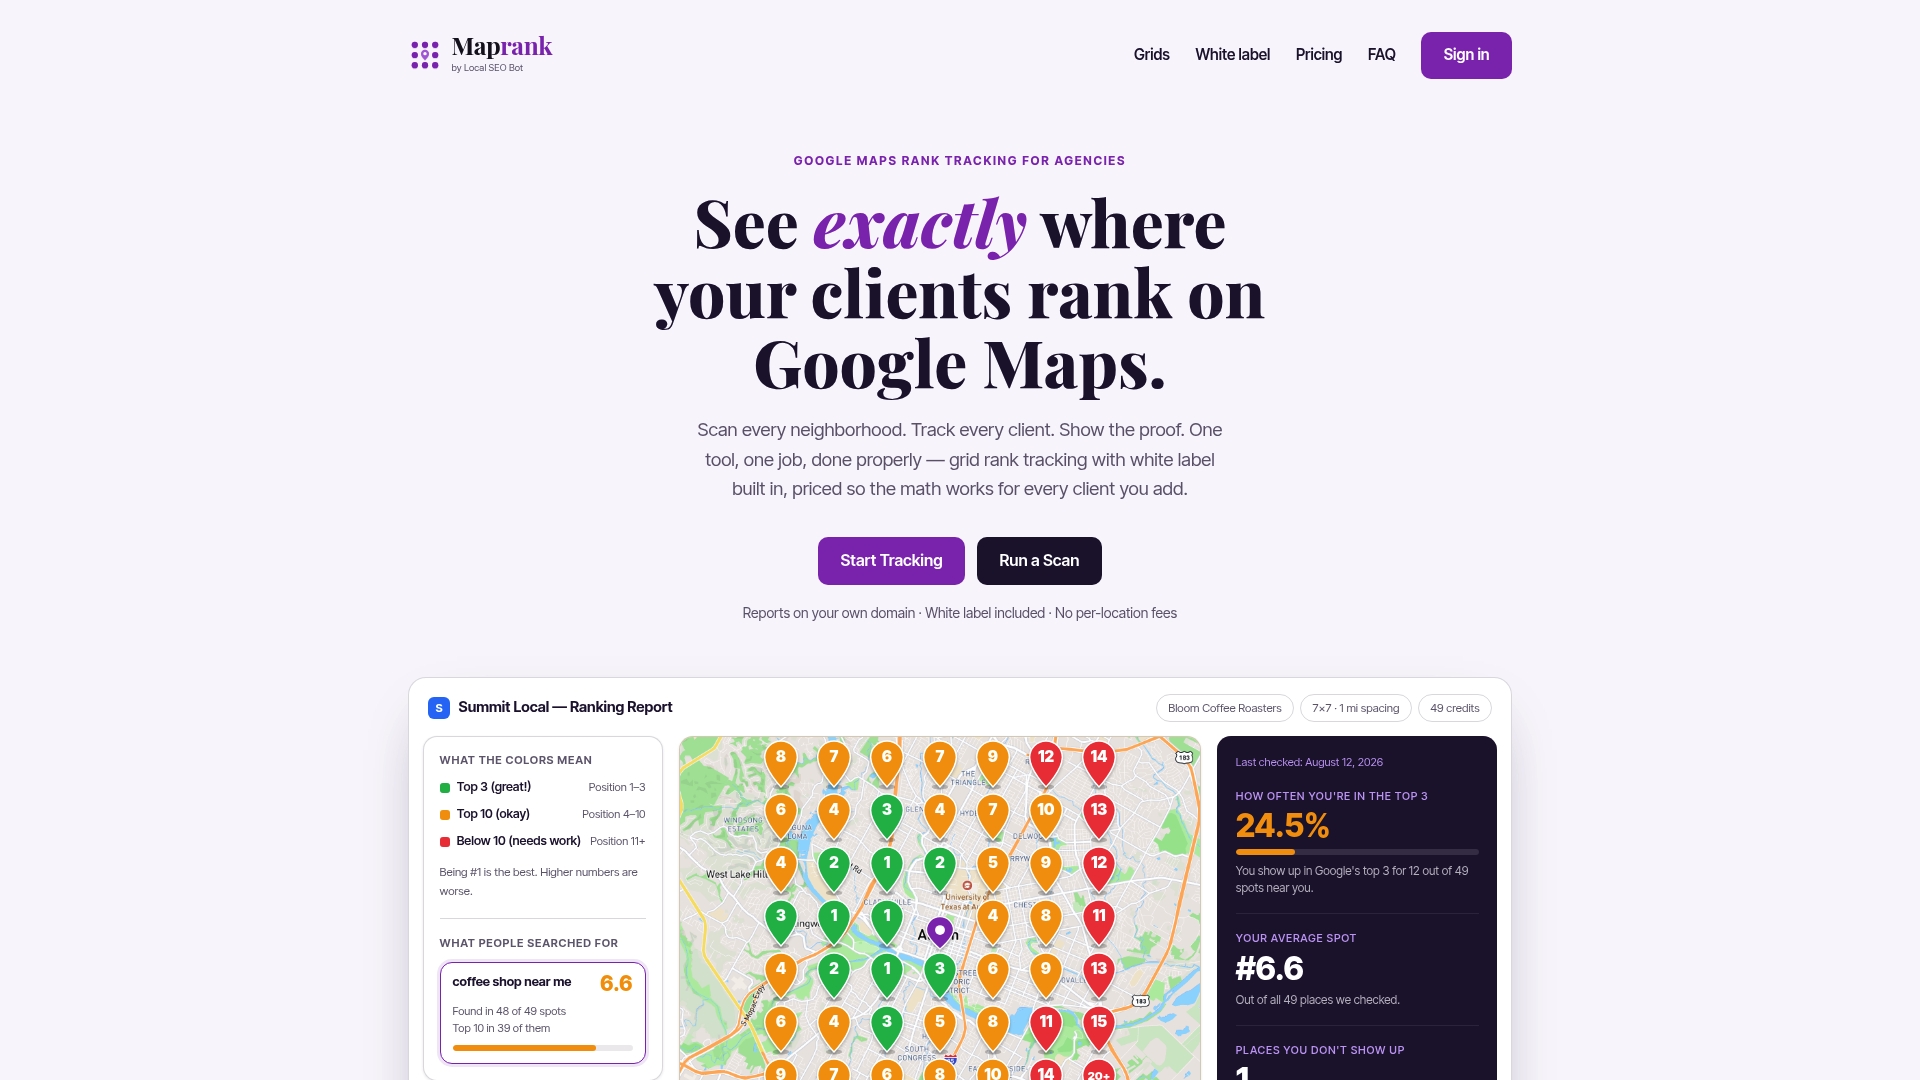
If you want to see how this looks against a current client’s service area before committing to a plan, start with a one-off rank check and build your next report from the export.
FAQ
What are 5 examples of metrics to measure local SEO performance?
The five core metrics for local rank reporting are ARP, ATRP, Found In, SoLV, and Google Business Profile interactions such as calls and direction requests. Together they cover ranking quality, overall visibility, coverage across a service area, market share, and the actions searchers take after finding a business, as outlined in Search Engine Land’s local SEO metrics guide.
What are the top priorities to boost local SEO performance?
Start with Google Business Profile accuracy and completeness, since category and listing issues show up directly in low Found In and ARP scores. From there, prioritize review acquisition, citation consistency, on-page content for each service area, and ongoing grid-based rank monitoring to catch competitor movement early.
Is a local SEO or visibility score of 92 good?
A score like this depends entirely on the scale and methodology behind it, since no single standardized “SEO score” exists across tools. A more reliable comparison is checking SoLV or ATRP against named competitors in the same grid scan rather than trusting a composite score in isolation.
What is the 80/20 rule as it applies to local SEO?
In local SEO, this idea generally refers to focusing the majority of effort on the highest-impact factors, typically Google Business Profile optimization and review generation, rather than spreading effort evenly across every possible ranking factor. Treat it as a prioritization principle rather than a fixed formula.
Sources
Every metric in a local rank report comes from a different source, and conflating them without noting their limits is where client trust erodes fastest.
Google Business Profile insights report views, searches, and actions like calls and direction requests, and can be downloaded for single or multiple profiles according to Google’s own performance documentation. Google Search Console adds organic query and click data for the website itself. Grid-scan exports from rank-tracking tools supply ARP, ATRP, SoLV, and Found In. Call-tracking platforms and GA4 round out the conversion side.
GBP data comes with specific limits worth stating in every report. Google counts a ‘view’ as a unique visitor once per day across devices and platforms, which means it will not match raw pageview counts from other tools, and performance data can lag by several days before it fully updates, per the same Business Profile help documentation.
Reconciling these sources takes a few habits:
- Key Metrics for Local SEO Success — Search Engine Land
- metrics-interpretation.md — local-falcon (GitHub)
For attribution, UTM tagging on every tracked link, normalized call-tracking numbers by campaign, and a consistent window (commonly 30 days) between a visibility change and when you check for a conversion response all help you avoid crediting a ranking improvement for a conversion spike that had another cause entirely.