Map Ranking Gap Analysis: Find Where Competitors Beat You
Map Ranking Gap Analysis: Find Where Competitors Beat You

A map ranking gap analysis compares where your business appears in Google’s local results against the businesses that outrank you, point by point across your service area. You pick the searches customers make, scan a grid of locations, note who holds the top three spots in each cell, and then work out why you lose in the cells you lose. The result is a short list of neighborhoods and causes to fix, instead of one average ranking that hides everything.
TL;DR
- Google Maps rankings change from block to block, so a single “I rank #2” check tells you very little. A gap analysis measures the whole service area.
- Choose 8 to 15 realistic searches, then treat the businesses that keep showing up in the top three as your real competitors.
- Scan a grid, mark the cells where you are outside the top three, and compare your profile with the rival that wins there.
- Fix the cause (categories, reviews, website link, service pages), then rescan on a schedule to see whether the cells turn.
- A grid tracker with flat, per-scan pricing makes repeat scans affordable for every client.
Table of Contents
- Why rankings differ from one block to the next
- Step 1: Pick the searches that matter
- Step 2: Find your true map pack competitors
- Step 3: Scan the whole service area on a grid
- Step 4: Read the heatmap and measure the gap
- Step 5: Work out why you lose where you lose
- Step 6: Turn findings into an action plan
- A worked example
- Our perspective
- Run your gap analysis with Maprank
- FAQ
- Sources
Why rankings differ from one block to the next
Google says local results are influenced mainly by relevance, distance and prominence, and that a business farther away can still rank higher if it is a better match for the search. Distance is measured from the searcher, not from your office. So the same search from two spots a mile apart can return two different sets of three businesses.
That is the whole reason a gap analysis exists. A competitor with a storefront on the east side of town may own every search made there, while you own the west side. Your average position looks fine, yet you are invisible to a third of the people you want to serve.
A gap, then, is any place or search where a competitor holds a map pack spot that your business should be able to win. It comes in two forms:
- Geographic gaps: areas of your service region where you drop out of the top three for a search you do well elsewhere.
- Query gaps: services where you rank nowhere, or far lower than for your main service, even though customers search for them.
Step 1: Pick the searches that matter
Start with what customers actually type. RankLocalToday suggests roughly 8 to 15 representative queries covering core services, urgent-intent terms, near-me searches and profitable secondary services. Fewer than that and you miss whole segments. A lot more and the analysis becomes unreadable.
Split the list by intent. ClicksGeek’s HVAC guide divides phrases into emergency, planned replacement and maintenance, and lets seasonal demand decide which get priority. The same logic works for any local trade. A sample list for a plumber might look like this:
| Intent | Example search |
|---|---|
| Emergency | emergency plumber |
| Core service | plumber near me |
| Specific job | water heater repair |
| Specific job | drain cleaning |
| Secondary, high value | tankless water heater installation |
| Neighborhood | plumber in [neighborhood name] |
The businesses that rank for one service often differ from those ranking for another. ClicksGeek’s plumbing guide recommends testing at least five to eight keyword variations for that reason. Do not assume your drain-cleaning rivals are your water-heater rivals.
Step 2: Find your true map pack competitors
Your real competitors are not necessarily the companies your client knows from offline. ClicksGeek points out that the relevant rivals are the ones appearing in the Maps 3-pack for the searches customers make.
The practical method:
- Run your searches in several spots across the service area.
- Record the three businesses in each pack.
- Count how often each business appears.
- Sort them: frequent appearances make a primary competitor, one or two appearances make a secondary one.
That last step follows ClicksGeek’s plumbing guidance, which treats businesses recurring across eight to ten searches as primary and the rest as ones to review later. Outscraper recommends choosing rivals that recur across searches instead of relying on one result, and offers five competitors as a practical benchmark: three for a quick look, ten or more for a large city. It also warns against comparing businesses with materially different services or geographic markets. A 24-hour emergency plumber and a remodeling contractor are not benchmarks for each other, even if both show up once.
Proximity belongs in this step. Eric Sachs argues that because Google uses the searcher’s location as a factor, anyone analyzing remotely must reproduce searches from the client’s local area instead of relying on one generic search. Writing down each rival’s address and distance from the client, as he suggests, quickly shows who wins by being close and who wins despite being far.

Step 3: Scan the whole service area on a grid
Checking five spots by hand works for a quick look. For a real analysis you want a grid: a set of evenly spaced points laid over the map, with your ranking recorded at each one for each search.
RankLocalToday recommends sampling the city center, your target neighborhoods or suburbs and the edge of the service area. A grid does this systematically, and a tool does it without you changing locations by hand. Our geo grid rank tracker guide explains how the heatmap view is built, and the service area rank tracker article shows how to apply it to neighborhoods.
Setup choices that change what you see:
- Grid size and spacing. Match the grid to how far customers realistically travel. A dense downtown business needs tight spacing over a few miles. A rural contractor needs a wide grid. Spacing that is too coarse hides pockets of weakness.
- Center point. Center on the business address for a first scan. Later, add scans centered on neighborhoods you want to grow into.
- One scan per search. Each keyword gets its own heatmap. Never merge them.
- Same settings every time. Keep grid size, spacing and keywords constant between scans, or you cannot tell real change from a changed setup.
Step 4: Read the heatmap and measure the gap
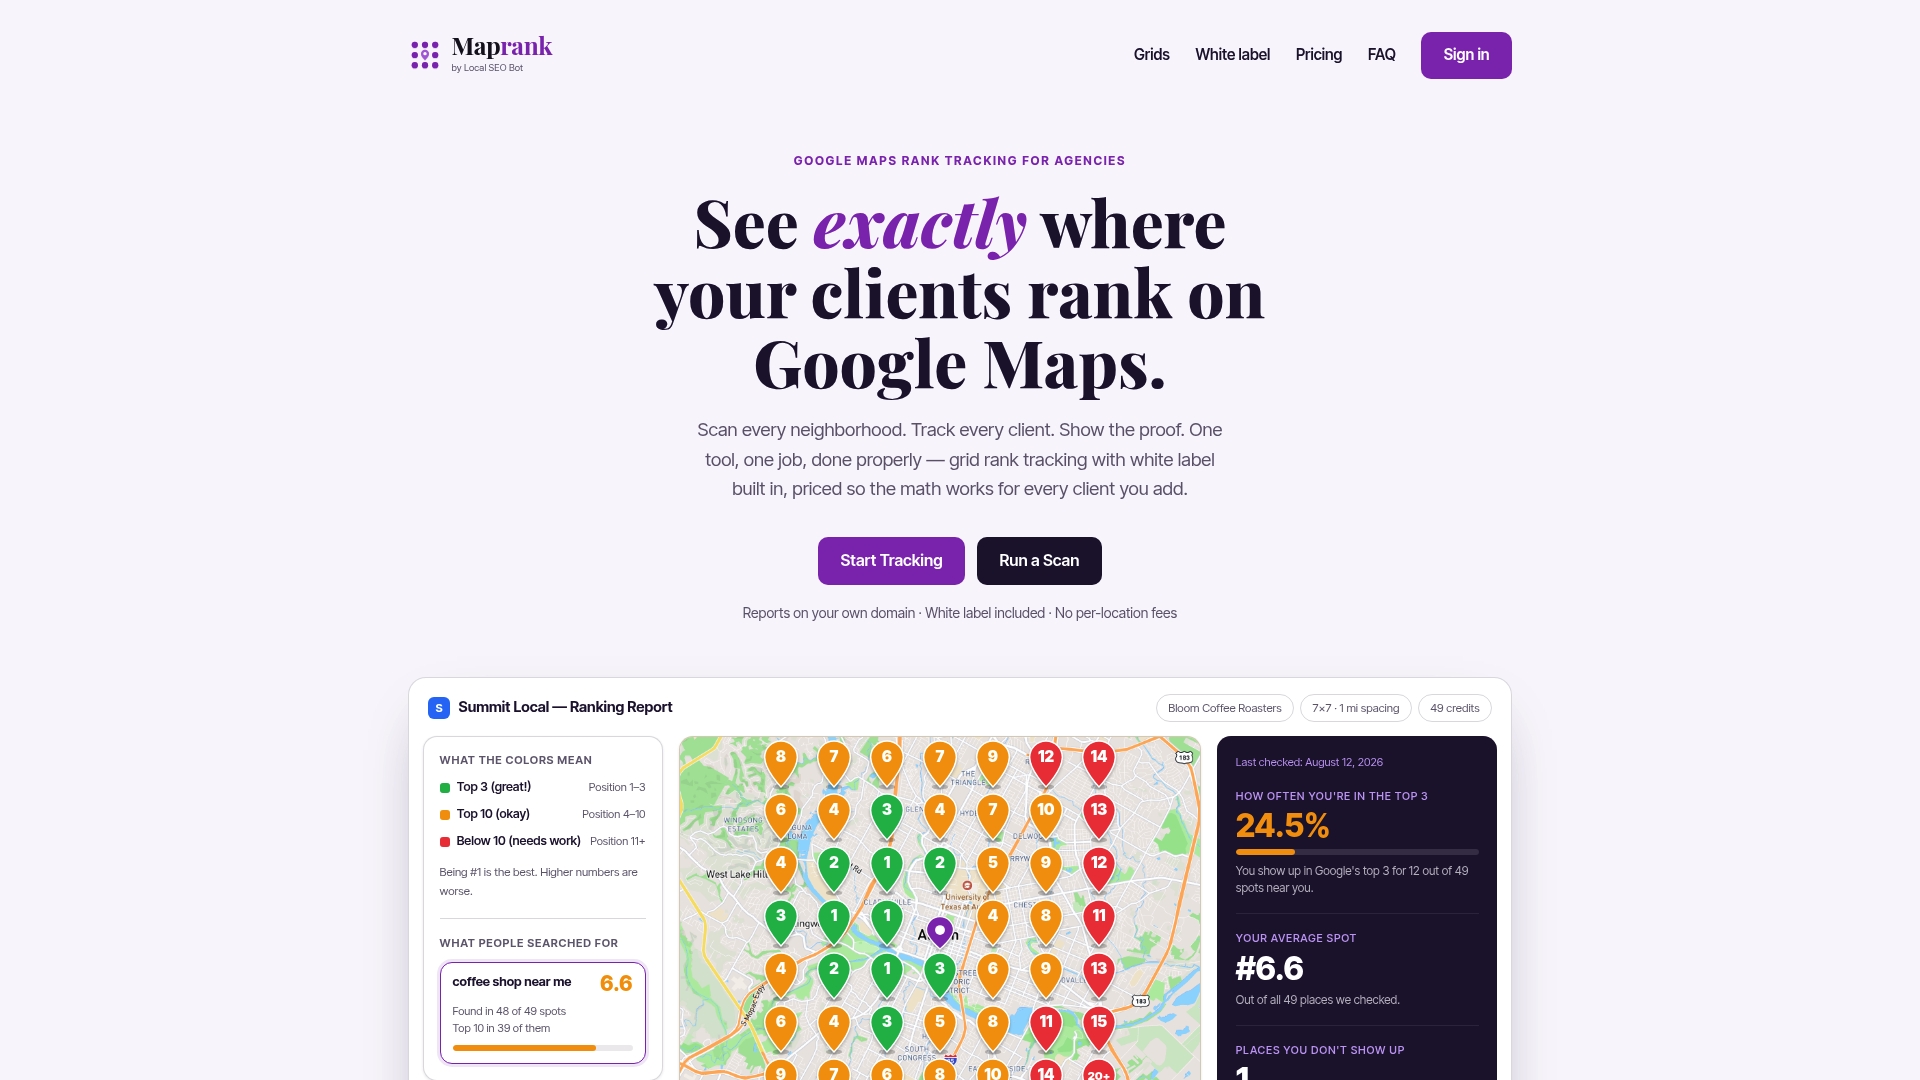
A heatmap colors each point by your position: green for the top three, then amber and red as you fall away, plus a marker for “not found.” Read it in three passes.
Shape. Is the green a blob around your address that fades with distance? That is normal, since proximity favors you near home. Is it lopsided, with a hole near your office? That suggests a competitor with strong prominence sitting close by.
Edges. The boundary between green and red is where your next gains live. Cells just outside the top three respond to improvement faster than cells at the far edge of the map.
Winners. For each red cell, note who holds the top three. If one business wins most of your red cells, it is your primary rival for that search. If different businesses win different areas, you face local specialists, and the fix differs by area.
Useful numbers to pull from each scan:
| Metric | What it tells you |
|---|---|
| Share of top-three cells | Share of the grid where you appear in the map pack |
| Average position | A summary, best read next to the share of top-three cells |
| Best and worst cells | Where you are strongest and where you vanish |
| Top competitor by cell count | Who is taking your missing coverage |
A caution on benchmarks: a 2025 study of one million grid ranks found top-performing businesses averaged about 2% Share of Local Voice across an 11x11-mile grid, in a sample of 10 industries and 10 US cities. That is a result for that sample, not a universal target. Compare yourself with the rivals in your own market, not with a published average.
Step 5: Work out why you lose where you lose
Once you know where the gaps are, compare your profile with the winner in that area. The same study reports that more reviews, especially recent ones, correlated with higher Local Pack rankings, while a higher star rating alone did not consistently predict stronger rankings. It also found that listings with more relevant Google Business Profile categories tended to do better, and that profiles whose website URL redirected performed worse than those linking directly. Treat these as correlations from one report, and use them as a checklist.
A side-by-side comparison of you and the top rival for a weak area:
| Check | Where to look |
|---|---|
| Primary and secondary categories | The business profile, on the rival’s listing |
| Review count and recency | Last 30 to 90 days of reviews |
| Service and product listings | Do they list the service you lost on? |
| Website link | Direct URL, or a redirect |
| Landing page | Does a page exist for that service and city? |
| Distance | Is the rival simply closer to that area? |
Distance deserves honesty. If the rival is a half mile from the red area and you are eight miles away, you may not win that cell soon, and chasing it can waste a budget. Move your effort to cells on the edge of your green zone.
Step 6: Turn findings into an action plan
Prioritize by effect and effort. A reasonable order:
- Fix profile basics: categories, services, a direct website URL, and accurate hours.
- Close query gaps: if you rank nowhere for a profitable secondary service, add it to the profile and build a page on your site for it.
- Build review flow: ask for reviews steadily, from customers in the weak areas, rather than in bursts.
- Create local relevance: pages and content that mention the neighborhoods you want to win.
- Rescan and compare: same grid, same keywords, on a set schedule.
Changes take time to show up, so avoid rescanning daily and drawing conclusions from noise. Monthly scans suit most local businesses, with weekly scans for highly competitive markets or when you are actively testing a change. Keep a log of what you changed and when, so you can link movement on the map to an action. Our guide to Google Maps grid rank tracking goes deeper on reading change across repeated scans.
A worked example
Imagine a drain-cleaning company with an office in the north of a mid-sized city. A first scan for “drain cleaning” shows green across the north, amber in the center and red in the south. Counting the top-three winners in the red zone, one competitor holds most of those cells and sits in the south.

Comparing profiles shows the rival has far more recent reviews and lists drain cleaning as a service, while our company lists it only in a general description. The plan: add the service to the profile, send review requests to customers in the central and southern neighborhoods, and publish a page for drain cleaning in the south. A rescan a month later will show whether the amber center has turned green. The south may stay red, and that is fine, since proximity is a real limit. The point is that effort went where it could pay off.
Our perspective
Most rank checks fail agencies in the same way: they report one number for a business that has hundreds of different rankings. The conversation with a client changes the moment you show a map where their street is green and the next suburb is red.
We built Maprank around that conversation. Grid scans are customizable in size and spacing, reports can carry your own branding on your own domain, and every plan includes unlimited businesses, so adding a client never adds a fee. We designed the pricing around scan credits, which means you know what a scan costs before you run it, and no Google account connection is needed to start.
A gap analysis is a repeating process, not a one-time audit. The agencies that keep clients are those that show the same grid improving month after month. Our job is to make that repetition cheap and clean to present.
Local
Run your gap analysis with Maprank
Maprank is a grid-based Google Maps rank tracker for agencies, consultants and freelancers. Every plan includes unlimited businesses and white label reporting, and pricing scales with scan credits, seats and grid size. Plans are Solo at $19 per month ($228 per year), Agency at $39 per month ($468 per year), Pro at $79 per month ($948 per year) and Scale at $149 per month ($1,788 per year). See the plans and pricing to choose the one that fits your client count.
If you only want to see how a business ranks today, the one-off rank check is the quickest way to get a first look. For a wider view of the category, see our local rank tracker overview. Home service agencies can start with our guide for home services.
FAQ
How many competitors should I include in a map ranking gap analysis?
Five is a practical benchmark, according to Outscraper. Use three for a quick comparison and ten or more for a big city or broad market. Choose the ones that recur across your searches.
How often should I rescan?
Monthly works for most local businesses, since profile and review changes take time to show on the map. Scan weekly only when you are testing a specific change in a competitive market. Keep grid size, spacing and keywords identical so results stay comparable.
Is a gap analysis the same as a keyword gap analysis?
No. A keyword gap analysis compares the terms your website ranks for in web search. A map ranking gap analysis compares your position in local results by location, so it shows where you win and lose geographically as well as for which searches.
Do I need access to my client’s Google account?
Not for grid scans in Maprank. Rankings are checked from the public results, so you can analyze a prospect or a competitor with no account connection, which makes it easy to build a pitch before a client signs.
Sources
- Search locations on Google Maps, Google Maps Help
- Local Competitor Analysis: A Step-by-Step Guide, RankLocalToday
- How to Build a Google Maps Competitor Benchmark, Outscraper
- How to Run a Google Maps Competitor Analysis for Your HVAC Business, ClicksGeek
- Google Maps Competitor Analysis for Plumbing, ClicksGeek
- Finding Your True Local Competition, Eric Sachs
- What 1,000,000 Grid Ranks Have to Teach Us About Local SEO, GMBapi