Service Area Grid Design: How to Size, Space and Center a Local Rank Grid
Service Area Grid Design: How to Size, Space and Center a Local Rank Grid

A good service area grid is centered on the business’s verified address, covers the area where real customers live and search, and uses a point count and spacing that match local density. Start with 7 x 7 points for a neighborhood business and 9 x 9 to 13 x 13 for a wider service area. Then trim points that fall on water, forest or empty land. Everything below explains how to make those choices and read the result.
This guide is for agencies, consultants and freelancers who run Google Maps grid scans for clients. It covers the center, boundaries, size, spacing, common mistakes and when to redesign a grid.
TL;DR
- Center the grid on the verified business location, then stretch or shift it toward the areas the business actually serves.
- Use an odd number of points per side so the business sits on the middle point. Start at 7 x 7 for a neighborhood and go up to 9 to 13 per side for a broad service area.
- Match spacing to density: tight in dense cities, wide in suburbs and rural areas.
- Trim points over water, forests and uninhabited land so they don’t drag down your averages.
- Never quote average rank without the found rate, and keep the same grid for every scan you want to compare over time.
Table of Contents
- What a service area grid shows that a single rank check cannot
- Choose the center first
- Set service area boundaries before you set the size
- How many points, and how far apart
- Read the grid in rings, not as one score
- Common grid design mistakes that distort the data
- Multi-location clients: one template is not enough
- When to redesign the grid
- Our perspective
- Run your grid with Maprank
- FAQ
- Sources
What a service area grid shows that a single rank check cannot
Google weighs distance heavily in local results, so the same business can be first on its own street, eighth a mile away and missing across town. A geo-grid measures from many points at once: you lay coordinates over the area the business serves, run the same Maps search from each point and record where the business appears. The output is a map of rankings instead of one number.
That matters because one check can flatter or mislead. One clinic example showed a business appearing third near its office but twelfth, twentieth or not at all about five kilometers away. A grid makes that drop-off visible, and visible problems are the ones you can sell a fix for.
The design of the grid decides whether that picture is honest. Wrong center, wrong spacing or wrong boundaries, and you get a pretty heatmap that answers a question nobody asked.

Choose the center first
The default center is the business’s verified address, because proximity to that pin is what Google is working from. Put the business on the middle point. That is why grid points per side should be an odd number: an even size cannot put the business on the center point.
There are cases where you should move the center:
- Service-area businesses such as plumbers or mobile detailers may serve neighborhoods far from their office. Center on the middle of the served territory and keep the address visible as a reference point.
- Businesses near a coast, river or park may have half their native grid in places no customer lives. Shift the center toward the populated side.
- Multi-location clients need one grid per location, each centered on its own pin, so overlapping coverage doesn’t blur the results.
Write the reason for the center in the client file. When someone asks in six months why the grid sits two miles north of the shop, you will have the answer.
Set service area boundaries before you set the size
Boundaries come from how customers actually reach the business, not from a radius drawn for convenience. Work from three inputs:
- Where current customers come from. Pull ZIP codes or neighborhoods from invoices, bookings or the client’s CRM.
- How far people will travel. A emergency locksmith serves a wide area. A yoga studio serves a few neighborhoods. A specialist surgeon pulls from a whole metro.
- What the client wants to win. A growth target is a legitimate boundary, as long as you label it as a target, not current reach.
Then apply real-world limits. Localogy recommends customizing geo-grids so the tracked area matches real service and customer search behavior, which includes disabling or trimming points over water, forests or other uninhabited land and shifting coverage toward populated, served areas. Points where nobody searches produce “not found” results that say nothing about the business and still pull your coverage percentage down.
Barriers count too. A river with two bridges, a mountain pass or a highway with no nearby exits can make a place that looks close on the map far away in drive time. If customers don’t cross it, the grid shouldn’t pretend they do.
How many points, and how far apart
Two settings do most of the work: size and spacing. A third, map zoom, affects how the search is made.
| Setting | What it controls | Sensible starting point |
|---|---|---|
| Size | Points per side (7 means 49 points) | 7 for a neighborhood business, 9 to 13 for a service area |
| Spacing | Distance between neighboring points | 0.5 to 1 km in dense cities, 2 to 5 km in suburbs and rural areas |
| Zoom | Map zoom the search runs at | 15 for street level, 13 for a wider area |
These starting values come from a geo-grid design guide. Treat them as defaults to adjust, not rules. Americans measure in miles, so a convenient translation is roughly a third to two thirds of a mile in a dense downtown and 1.25 to 3 miles in suburbs and rural areas.
To pick the numbers, multiply. Total width is roughly (points per side minus 1) times spacing. A 9 x 9 grid at 2 km spacing spans about 16 km edge to edge, which is around 10 miles. Check that number against the boundary you set in the last step. If the grid is wider than the customer area, tighten the spacing. If it is narrower, add points or widen spacing.
Density changes the answer
In a dense city, a business’s rank can change within a few blocks, so tight spacing reveals real detail. In a sparse suburb, tight spacing just burns scans on near-identical results. Localogy also advises adjusting grid size and spacing for different service-area sizes and competitive density across locations, so a client with a downtown branch and a suburban branch should not share one template.
A quick worked example
Take a dental practice in a mid-sized suburb. Patients come from about a 6-mile radius, and a lake covers the southeast corner. A reasonable design: 9 x 9 points at 1.5-mile spacing, which spans about 12 miles, centered on the office. Then switch off the handful of corner points over the lake and beyond the patient radius. You end up with roughly 65 to 70 active points instead of 81, each one meaningful.

Read the grid in rings, not as one score
Once the grid runs, resist the single headline number. Merged Media divides a local ranking grid into three zones: a near ring close to the verified location, a middle ring where proximity weakens and stronger competitors may take over, and an outer ring at the edge of the target market where distance is harder to overcome. Comparing patterns across rings tells you more than reacting to one ranking number.
A practical reading:
- Weak near ring: a basics problem, such as category, profile completeness or reviews. Fix this first.
- Strong near ring, collapse in the middle: competitors with stronger prominence are winning once distance stops helping you.
- Weak outer ring only: normal for most businesses. Decide whether the client really wants those customers before spending effort there.
Report average rank with the found rate
The two most quoted grid metrics use different denominators. One guide gives an example in which a business found at 2 of 25 points can show an average rank of 1.0 but top-3 coverage of 8%. Its advice is simple: never quote the average without the found rate beside it. Put both in every client report.
Common grid design mistakes that distort the data
- Radius by habit. Using the same 5-mile circle for every client ignores how customers actually behave.
- Grid too small. If the outer ring is already full of top-3 rankings, you have never found the edge, so you can’t see where visibility ends.
- Grid too large. Scans over empty land inflate “not found” counts and make a healthy local business look weak.
- Business off center without a reason. An accidental offset makes one side of the grid look stronger than it is.
- Changing the grid between scans. Moving points or spacing and then comparing to last month tells you about your settings, not about rankings.
- Ignoring keyword intent. A grid for “emergency plumber” should usually be wider than one for “plumber near me open Sunday” at a single neighborhood shop. Run keywords with different reach on grids that fit them.
For more on how the scan itself works, see our explainer on the local rank grid scan.
Multi-location clients: one template is not enough
When a client has several locations, each one needs its own center, boundary and spacing. Overlapping grids double-count the same customers, and a downtown location and a rural one don’t share a density. A scalable multi-location SEO approach starts with treating each location’s service area, population, barriers and competition as its own case, and the grid should follow the same logic. Build a template per market type (dense urban, suburban, rural), then tune each location from there.
When to redesign the grid
Keep a grid stable for as long as you want to compare results. Redesign it only for a clear reason, and when you do, record the date and start a new baseline. Good reasons:
- The client opens a new location, moves, or starts serving a new area.
- Customer data shows people coming from outside the current boundary.
- The outer ring has been strong for several scans, which suggests the edge is farther out.
- A large share of points return “not found” because they sit over land nobody searches from.
- A new competitor, highway or development changes how people reach the business.
If the reason is only that the results look bad, don’t redesign. Bad results on a sound grid are the finding.
Our perspective
We built Maprank around a simple belief: the grid should fit the client, not the pricing page. Agencies we talk to are tired of tools that charge per location or tangle pricing around seats and accounts, so they end up designing grids to protect a budget instead of to answer a question.
Our approach is designed to remove that pressure. Every plan includes unlimited businesses and white label reporting on your own domain, and you choose the grid size and spacing yourself. Pricing runs on scan credits, so a thoughtful design, a trimmed grid with the right spacing for each client, is also the efficient one.
We also don’t ask for Google account connections. You can scan a prospect’s neighborhood before they have given you any access, then show them the map in a branded report. That is often what turns a discovery call into a signed client.
Local
Run your grid with Maprank
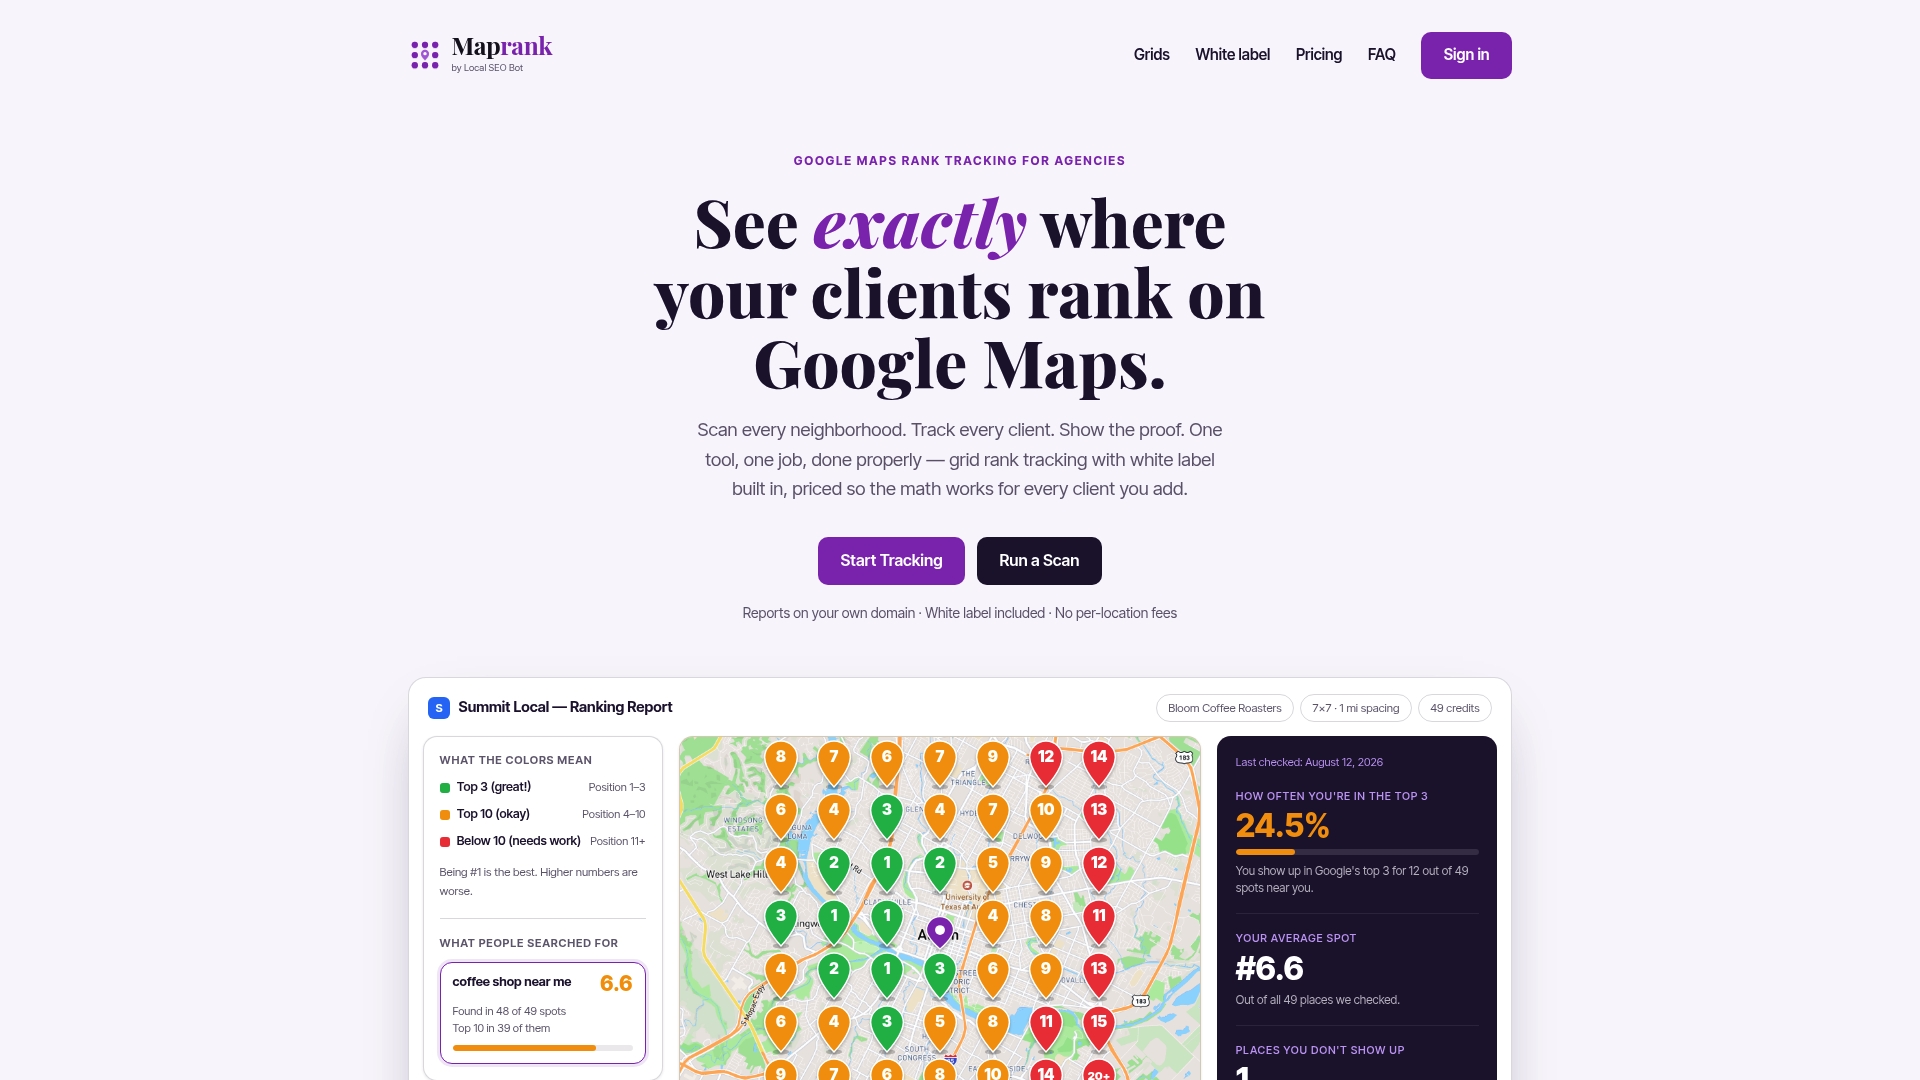
Maprank is a grid-based Google Maps rank tracker for agencies, consultants and freelancers. You set the grid size and spacing, add as many client businesses as you need and send white-label reports on your own domain, with no Google account connection. Plans on the Maprank site are Solo at $19 per month ($228 per year), Agency at $39 per month ($468 per year), Pro at $79 per month ($948 per year) and Scale at $149 per month ($1,788 per year).
Want to see a single location first? Try a one-off Google Maps rank check. For a wider view of how grid tracking fits an agency workflow, read our guide to a Google Maps rank tracker for agencies.
FAQ
What is the best grid size for local rank tracking?
For a neighborhood business, 7 x 7 (49 points) is a sound start. For a broader service area, 9 x 9 up to 13 x 13 works better. Pick an odd number so the business sits on the center point, then trim points that fall outside the real customer area.
How far apart should grid points be?
In dense cities, roughly 0.5 to 1 km (about a third to two thirds of a mile) shows block-level changes. In suburbs and rural areas, 2 to 5 km (about 1.25 to 3 miles) is more practical. Check that the total width matches the boundary you set.
Should the grid be centered on the business address?
Usually yes, since Google’s local results lean on distance. Shift the center when the business serves an area away from its office or when part of the grid covers water or empty land. Note the reason so later scans stay consistent.
Can I change the grid after the first scan?
You can, but treat it as a new baseline. Changing points or spacing and comparing to earlier scans mixes design changes with ranking changes. Redesign when the business, its customers or its market changes, and log the date.
Sources
- Geo-Grid Rank Tracking: Measuring Local Rankings Block by Block
- Why Multi-Location Businesses Need Custom Geo-Grid Rank Tracking (Localogy)
- Why Your Business Ranks Nearby but Disappears Across Town (Merged Media)
- Choosing a grid size and reading the heatmap (learn.seog.ai)
- Multi-Location SEO: A Scalable System That Actually Works