Unlimited Locations Tracking for Local SEO Agencies
Unlimited Locations Tracking for Local SEO Agencies

Unlimited locations tracking means you can add as many client businesses and service areas as you manage, and you pay for the scans you run, not for each location you add. For a local SEO agency, that is the difference between a rank tracker that grows with your client list and one whose bill grows every time you sign a client. This guide explains what is being measured, how to set up grids you can compare month to month, which metrics show coverage gaps, and how to report results location by location.
TL;DR
- Unlimited-location tracking should mean no per-location or per-business fee. Cost should follow scan volume (credits), not client count.
- Grid tracking checks your Google Maps rank from many points around a business, so you see rankings by neighborhood instead of one number.
- Keep keyword, grid size, spacing and scan settings fixed so changes in your data reflect visibility, not a changed method.
- Judge a location by coverage (how many grid points show it in the top 3) as well as average position.
- Organize reports by client, then location, then keyword, and deliver them white-labeled on your own domain.
Table of Contents
- What “unlimited locations” actually measures
- Why per-location pricing hurts agencies
- How to build a grid you can trust
- How often to scan
- Metrics that reveal coverage and gaps
- What to do when a grid shows weak areas
- Organizing results across many locations
- Our perspective
- Pricing that follows scans, not locations
- A sample setup for a new client
- Mistakes to avoid
- FAQ
- Sources
What “unlimited locations” actually measures
Two very different things share this phrase online. Search it and you will mostly find GPS devices that follow vehicles and phones. This article is about something else: tracking where a business appears in Google Maps and the local pack, for as many businesses and locations as an agency manages.
Local rankings are not one fixed list. Google says local results are based mainly on relevance, distance and prominence. Distance is the piece that makes a single rank number misleading. A dentist can sit in position 1 for a searcher standing next to the office and in position 14 for someone two miles away. Both are true at once.
Grid rank tracking solves this by running the same search from a set of coordinates laid out over a map, for example 5x5 or 7x7 points. Each point returns the rank a searcher at that spot would see. The result is a heat map of strong and weak neighborhoods.
“Unlimited locations” is the commercial side of the same idea. Many trackers charge per tracked location, so a client with four branches, or a service-area business you want to monitor across three cities, multiplies your cost. An unlimited model removes that multiplier. What you consume is scans.

Why per-location pricing hurts agencies
Per-location pricing creates three problems that show up in agency life, not on a pricing page.
It punishes growth. Every new client or branch adds a line item. Your margin on a retainer shrinks the moment the client asks you to track a second location.
It discourages the right measurement. If each location costs extra, you track the main office and skip the satellite branch, the competitor-heavy suburb or the second keyword. The data you most need is the data you leave out.
It makes quoting hard. You need to estimate your tool cost before you know how many locations a prospect will end up wanting. Predictable pricing lets you set a retainer once.
When you evaluate any tracker, ask five questions:
- Is there a fee per business, location or client?
- What is actually metered: scans, keywords, grid points, or seats?
- Are white-label reports included, or a paid add-on?
- Does it need access to your client’s Google account?
- Can you choose grid size and spacing, or are they fixed?
Only the second question should have a usage-based answer, and it should be easy to forecast.
How to build a grid you can trust
A tracker is only as useful as its method. Most of the confusion in rank reports comes from changing something without noting it.
Choose keywords with intent
Start with the three to five searches a customer really types when ready to buy. For a plumber, that might be “emergency plumber” and “water heater repair”, not every variation of the word plumber. Add one broad category term and one or two high-value service terms. More keywords means more credits spent, so start narrow and expand where the data shows opportunity.
Use the words customers use, not the words in the business’s service menu. Check the keyword against the Google Maps results yourself: if the results are mostly informational pages or national brands, it is not a local-pack keyword and a grid will tell you little.
Pick the center point and radius
Center the grid on the business address for a storefront. For a service-area business, center it on the middle of the area it serves, then extend the grid to the edges of where it takes jobs. A grid that stops at the city limit will miss the suburbs where a contractor gets half its work.
A practical way to choose:
| Business type | Suggested grid | Why |
|---|---|---|
| Single-location storefront (cafe, salon) | 5x5, tight spacing | Customers come from a few miles around |
| Service-area business (HVAC, roofing) | 7x7 or larger, wider spacing | Work area is broad and rankings fade with distance |
| Multi-location chain | One grid per branch, same settings | Lets you compare branches fairly |
| Rural or regional business | Fewer points, large spacing | Searches cover bigger distances |
These are starting points, not rules. With customizable grid size and spacing, you can tighten a grid around a problem area later.
Lock the settings
For scans you want to compare month to month, repeat the same query, language, location, device type, grid design and cutoff, and record the date and time of each run. If you must change the grid size or the keyword string, label that change in the report so a client does not read a method change as a ranking drop or gain. Build that habit from the first scan: write the settings into the first report so everyone knows the baseline.
How often to scan
There is no universal schedule. Match the cadence to what you can act on.
- Monthly suits most retainer clients. It shows the effect of work done in the last 30 days without producing noise you must explain.
- Every one to two weeks fits a launch, a new Google Business Profile, or a campaign where you are changing categories, services or photos and want faster feedback.
- Before and after a specific change works as a quick check. Run a scan before you edit a profile and another after enough time for the change to show up.
Avoid scanning daily just because you can. Local results move for reasons that have nothing to do with your work, and a daily line chart invites you to chase fluctuations. Treat each scan as a sample. One scan is a data point, and the trend across several is the finding.
Metrics that reveal coverage and gaps
A grid produces dozens of numbers per scan. Three summaries do most of the work.
| Metric | What it tells you | Watch for |
|---|---|---|
| Average rank position | Mean rank across the points where the business appears | Can look healthy while many points show no ranking |
| Top-3 coverage (share of grid points in the top 3) | How much of the area the business owns in the local pack | The best single measure of real visibility |
| Points not ranking | Where the business is absent | These are your gaps and your next to-do list |
Coverage matters because customers mostly see the first few results in the map pack. A business ranking 4th at every point looks fine on average and still gets little of the map-pack attention. A business in the top 3 at 40% of the points and absent elsewhere has a very different problem: it is strong near the office and invisible beyond a certain distance.
Read the map, not just the table. Look for patterns:
- A strong center that fades evenly is normal, because distance counts in local ranking.
- A hole on one side often means a competitor is clustered there, or the business has weak relevance signals for that area’s searches.
- Strong in some keywords, absent in others points to category or content issues rather than location.
- Gaps near a competitor’s address are expected. Gaps in areas with no nearby competitor are opportunities.
Telling real change from noise
Local results vary by searcher, time and device, so no tool can promise a single fixed rank. Use these checks before you tell a client the rankings moved:
- Did the settings stay identical between scans?
- Did coverage change across many points, or did one or two points flip?
- Has the change held across two or more scans?
- Does it line up with something you did, such as a profile edit, new reviews or a new category?
If the answer to the first two is yes and the change repeats, you have a trend. If only a few cells moved once, note it and keep watching.
What to do when a grid shows weak areas
Tracking is useful only if it leads to action. Google states that there is no way to request or pay for a better local ranking, so the work is improving the signals it uses: relevance, distance and prominence.
Distance you cannot change, but you can work with it. Common responses to a weak zone:
- Relevance: make sure the primary category fits the service you want to win, add all services, and write a complete business description. Compare the profile against the businesses winning in the weak area.
- Prominence: earn more recent reviews, respond to them, and build local mentions and links that match the area.
- Distance gaps: if a zone is far from the address, create location-specific content and service-area pages, and decide whether a branch or a different approach is realistic. Some zones will stay weak, and that is a legitimate finding to share with the client.
For a deeper list of tactics, see our guide to improving your Google Maps ranking. Then rescan with the same settings to see whether the weak area moved.
Organizing results across many locations
When you track dozens of businesses, structure matters as much as scanning. Use the same hierarchy for every client:
- Client (the business or brand)
- Location (each branch or service area)
- Keyword (the three to five that matter)
- Scan history (dated, with settings listed)
Name things consistently. “Austin North | emergency plumber | 7x7” tells anyone on the team what they are looking at. Keep one naming scheme across all clients and your reports become comparable.
For multi-location clients, build a one-page summary showing each branch with its top-3 coverage and the change since last scan, then link to detail per location. Branch managers care about their own map, and the owner cares about the ranking of the weakest branch. Our guides to multi-location rank tracking and tracking multiple locations on Google Maps go deeper on dashboards and workflows.
Reporting to clients
Clients do not want a spreadsheet of positions. They want to know whether more people nearby can find them. A report that works:
- Opens with one sentence: where visibility is now and how it changed.
- Shows the grid map for each priority keyword, current next to previous.
- Lists what you did this period and what you will do next.
- Notes any method change, such as a new grid size, so comparisons stay honest.
White-label reporting lets you deliver this under your brand, on your own domain, so the client sees your agency, not a third-party tool. That supports retention: a map that goes from red to green in a neighborhood the client cares about is easier to understand than an explanation of algorithms.
Our perspective
We built Maprank because agencies kept telling us the same thing: the tracker was fine until the client list grew, and then the pricing stopped making sense.
Our view is that location count should never be what you pay for. Agencies earn by covering more businesses, more neighborhoods and more keywords. A tool that charges for each of those is working against the agency’s business model. So on every plan we include unlimited businesses and white-label reporting, and the meter is scan credits, which you can forecast.
We also think a tracker should not need your client’s Google login. Grid scans measure what searchers see, so they do not require account access, and onboarding a client takes minutes rather than a permissions request.
Finally, we believe you should choose your own grid. Our scan grids are customizable in size and spacing, because a rural contractor and a downtown cafe do not need the same map. Consistent settings plus clear reports are how you turn rankings into a story clients stay for.
Local
Pricing that follows scans, not locations
Maprank is built for agencies, consultants and freelancers who manage local SEO for several clients. Every plan includes unlimited businesses and white-label reporting. The plans differ in scan credits, seats and grid size.
| Plan | Monthly | Annual |
|---|---|---|
| Solo | $19 per month | $228 per year |
| Agency | $39 per month | $468 per year |
| Pro | $79 per month | $948 per year |
| Scale | $149 per month | $1,788 per year |
Prices are as published on our site; check the Maprank plans page for current credit allowances and seats. If you want a single check before committing, our Google Maps rank tracker offers a one-off rank check.
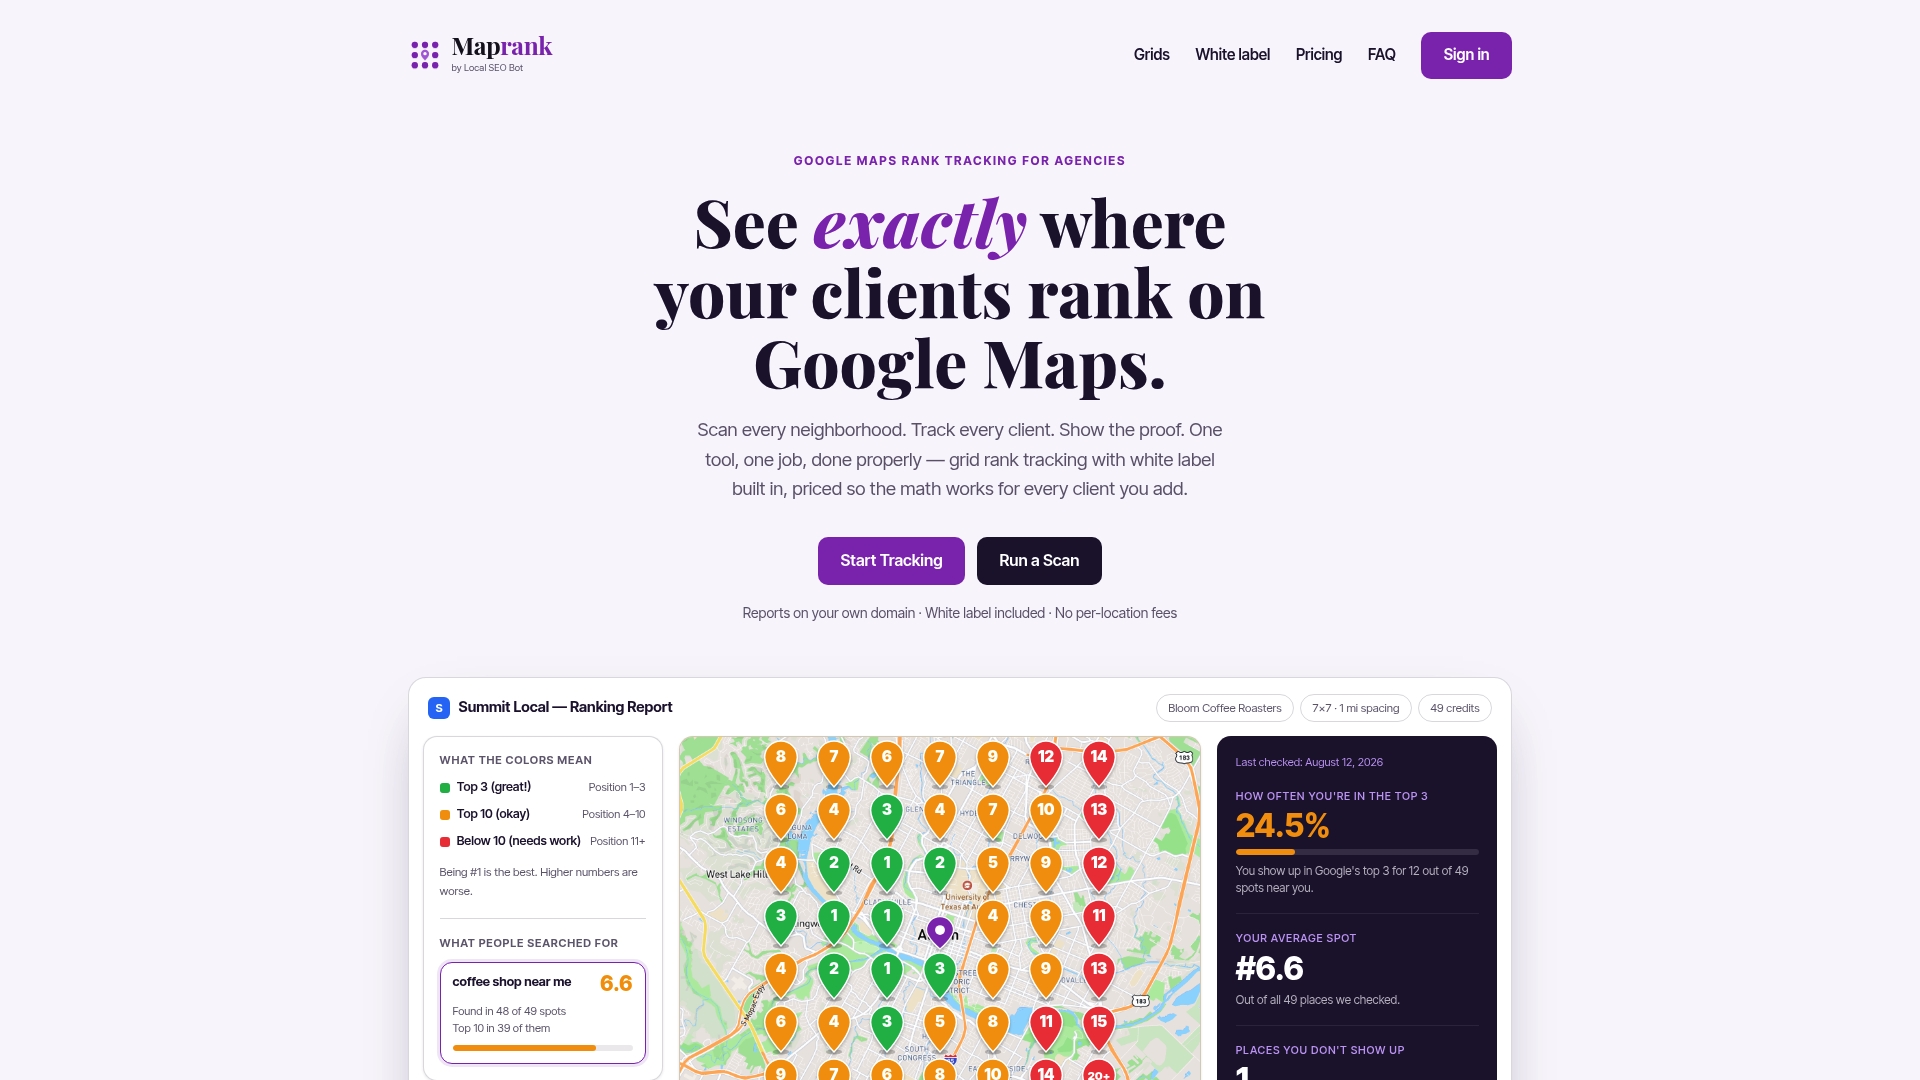
If you want to see grid tracking on a real client before you decide, our local rank tracker maps a whole service area, and the grid rank tracker guide shows how to read the output.
A sample setup for a new client
Here is a workable first month for a client with two locations, to show how the pieces fit.
Week 1: baseline. Pick four keywords per location. Run a 7x7 grid for each. Save the settings in the report: keyword, grid size, spacing, date and time. Note the top-3 coverage and the points with no ranking.
Week 2: diagnose. Compare each location’s map with its nearest competitors. Identify the one or two weakest zones and decide whether the cause is relevance (category, services), prominence (reviews, mentions) or plain distance.
Week 3: act. Fix profile fields, ask for reviews, publish location-specific content for the weak zone. Do not change the grid.
Week 4: rescan and report. Run the identical grids. Report coverage change, show maps side by side, and list next steps. If you want to test a new keyword, add it as a separate series and label it, so the original trend stays clean.
Because businesses are unlimited, adding the client’s third branch next quarter costs nothing extra beyond the scans you run for it.
Mistakes to avoid
- Changing the grid without saying so. A larger grid will usually lower average rank because it includes farther points. That is not a decline.
- Tracking too many keywords. Credits spent on vanity terms are credits not spent on the money keywords.
- Reporting only the average. Always show coverage alongside it.
- Promising a ranking. Present scans as samples of visibility, and promise the work you will do.
- Ignoring the competitor view. Rank is relative. Study who holds the points you do not.
FAQ
What does unlimited locations tracking mean?
It means a rank tracker does not charge per business or per location. You can add every client and branch you manage, and your cost depends on how many scans you run. Always check what the plan meters, since limits can hide in keywords, seats or grid size.
Do I need access to my client’s Google account to track rankings?
Not with grid scans. They measure what searchers see in Google Maps from specific coordinates, so they work from the public results. Maprank does not require Google account connections, which makes onboarding quicker.
How many keywords and grid points should I use?
Start with three to five keywords per location and a 5x5 or 7x7 grid. Widen the grid for service-area businesses that work across a large region. Keep the settings fixed once chosen so scans remain comparable.
Can I send reports under my own brand?
Yes. Maprank includes white-label reporting on every plan, on your own domain, so clients see your agency’s name. See our Google Maps rank checker for a first look at the output.
Can anyone guarantee a Google Maps ranking?
No. Google says you cannot pay for or request a better local ranking, and results vary by searcher and location. A tracker shows where you stand and whether your work is moving visibility.
Sources
Recommended
- Local SEO Rank Tracking for Multi-Location Businesses: One Dashboard for Every Location
- Google Maps Rank Tracker for Multiple Locations: Scale Your Local SEO Monitoring
- Google Maps Rank Tracker for Agencies: Scale Local SEO Reporting for Every Client
- Automated Rank Tracking for Local SEO: Save Hours Every Week