5 Steps to Run Repeatable Geogrid Programs for Agencies
5 Steps to Run Repeatable Geogrid Programs for Agencies

Geogrid SEO tracks how a business ranks on Google Maps from dozens of separate points across its service area instead of one average position. For agencies, the payoff is concrete: it exposes which neighborhoods already convert, which sit one review or one landing page away from the map pack, and which are lost causes worth abandoning. Run a medium-sized grid on a few key money keywords before your next client call.
TL;DR:
- Effective geogrid tracking should focus on the yellow near-miss cells, as small improvements there can quickly turn into top-3 gains.
- Consistent scan timing and fixed grid parameters are crucial to accurately track ranking changes over time and avoid misleading noise.
- Running a small, high-intent keyword grid monthly provides more actionable insights than spreading credits across many keywords inconsistently.
- Pair geogrid data with Google Business Profile insights and website analytics to diagnose the true cause of ranking or conversion issues.
- Using a transparent credit-based tool like Maprank ensures predictable costs and customizable reports optimized for agency branding.
Table of Contents
- What Is Geogrid Rank Tracking, and What Metrics Matter?
- How a Geogrid Scan Actually Works, Step by Step
- Choosing the Right Grid Size and Spacing
- Reading the Heatmap: What Green, Yellow, and Red Mean for Your Next Move
- Geogrid vs. Standard Rank Tracking: When Each One Earns Its Keep
- Building a Repeatable Agency Workflow for Geogrid Programs
- Turning Geogrid Data Into a Report Clients Actually Read
- How Maprank Handles Grid Tracking for Agencies
- Common Problems That Break a Geogrid Program (and How to Fix Them)
- Connecting Geogrid Data to the Rest of Your SEO Stack
- What Actually Moves the Needle in a Geogrid Program
- Try Maprank to Run Your Next Geogrid Scan
- Sources
What Is Geogrid Rank Tracking, and What Metrics Matter?
Geo grid rank tracking, sometimes called grid rank tracking or a grid scan, queries Google from a set pattern of GPS coordinates spread across a service area. Each point returns its own local ranking, and the tool stitches those results into a color-coded heatmap showing exactly where a business sits inside the top 3 and where it disappears from the local pack entirely.
The raw output usually includes three layers:
- A visual heatmap with green, yellow, and red cells
- A per-point list of exact rankings, often down to position 20
- Competitor pins showing who occupies each cell when your client doesn’t
Four metrics do the real work. ARP (Average Rank Position) is the mean position across every grid point. ATRP (Average Top Rank Position) narrows that to only the points where the client appears in the top 10, which filters out noise from total blackout zones. SoLV (Share of Local Voice) measures the percentage of grid points where the business shows up in the map pack at all, and it’s usually the single number clients understand fastest. Percentage top-3 coverage rounds things out by showing what portion of the grid sits in the highest-value zone.
Proximity drives almost all of the variance you’ll see between cells. A business can rank first two blocks from its storefront and fall to position 15 a mile away, and that swing is the entire reason averages lie.
How a Geogrid Scan Actually Works, Step by Step
Every geogrid tool, whether you’re evaluating a vendor or building your own QA process, runs the same four-stage loop.
- Define the grid. Set a center point (the storefront address or service-area centroid), pick a grid size like 5x5 or 7x7, set spacing between points, and lock a time window for the scan.
- Query each point. The tool sends a search request from every GPS coordinate in the grid and records the map-pack results, typically capturing top-3, top-10, and sometimes top-20 positions.
- Render the heatmap and compute metrics. Results get color-coded by rank tier, and the system calculates ARP, ATRP, SoLV, and top-3 coverage across the full grid.
- Compare across time. Running the same grid monthly reveals green-area expansion or contraction, turning a static snapshot into a trend line you can hand a client.
Pro Tip: Screenshot or export every scan, not just the ones that look good. A grid that shows regression is often more useful in a client meeting than one that shows growth, because it’s the fastest way to justify next month’s budget.
The comparison step is where most agencies stumble. A scan run at 9 a.m. on a weekday and compared against one run at 6 p.m. on a Saturday isn’t measuring change. It’s measuring noise.
Choosing the Right Grid Size and Spacing
Proper grid geometry is important to avoid wasting credits on irrelevant areas or missing neighborhood-level details important for dense urban clients.
- 3x3 (9 points): Fast, cheap checks on a single neighborhood or a very tight service radius.
- 5x5 (25 points): The default for most urban clients with one or two competing commercial corridors.
- 7x7 (49 points): City-wide tracking for businesses that pull customers from across a metro core.
- 9x9 (81 points) and larger: Metro-area or multi-city service businesses that need to see coverage gaps at scale.
Spacing should track population density: 0.25 to 0.5 miles between points for dense urban cores, 0.75 to 1 mile for suburban service areas, and 1.5 miles or more once you’re covering rural or sprawling metro territory. A dense downtown grid with 1.5-mile spacing will miss every proximity cliff that matters. A suburban HVAC client scanned at 0.25-mile spacing just burns credits measuring streets that are functionally identical.
Reading the Heatmap: What Green, Yellow, and Red Mean for Your Next Move
The color tiers aren’t just a status report. Each one implies a different action, and treating them the same way is how agencies waste a client’s budget.
- Green (top-3 coverage): The work is done here. Monitor for saturation and watch for new competitors entering the cell, but don’t spend fresh budget on neighborhoods that already convert.
- Yellow (near-miss, positions 4 to 7): This is the highest-leverage zone in the entire grid. A handful of new reviews, a localized landing page, or a Google Business Profile tweak often flips a yellow cell to green faster than any other tactic.
- Red (dead zones or entrenched competitors): This requires a real decision. Either commit to a hyperlocal content and citation push, or accept the boundary and redirect budget toward yellow cells with a better return.
Grid scans consistently reveal these near-miss pockets, and positions 4 through 7 tend to be the fastest wins in a geogrid program precisely because the business is already visible, just not visible enough.
Reporting only an average rank across the whole grid buries this story. A single ARP number can look stagnant even while ten yellow cells flip green and five green cells slip to yellow, canceling each other out on paper. Visual heatmap deltas and per-cell competitor tracking show the client what’s actually happening on the ground.
Geogrid vs. Standard Rank Tracking: When Each One Earns Its Keep
Geogrid tracking and standard rank tracking solve different problems, and running the wrong one wastes budget either way.
- Use geogrid scans for any business tied to a physical location or a service area where proximity to the searcher changes the ranking.
- Use standard rank tracking for keywords with no local intent, or when a client just needs a single national trend line for an e-commerce or SaaS product.
- Geogrid tracking is overkill for a single-location client with no real competition nearby. It’s essential for anyone competing across a multi-neighborhood metro.
- Cadence should flex with the work: a monthly baseline scan is enough for stable listings, while active optimization pushes or new-location launches justify weekly runs.
Running a 49-point weekly grid on a client with no local competitors just burns credits on a story that never changes.
Building a Repeatable Agency Workflow for Geogrid Programs
A geogrid program only produces defensible, comparable data if the setup stays consistent from scan to scan. Here’s the sequence that holds up across multiple clients.
- Pick 3 to 5 money keywords with obvious local intent (think “plumber near me” or “downtown dentist”), since narrowing the keyword list controls credit spend and keeps optimization focused.
- Set the grid center correctly. Use the storefront address for retail and brick-and-mortar clients; use a calculated centroid of the service area for service-area businesses (SABs) with no public address.
- Lock the grid size and spacing before the first scan, and don’t touch them again unless the client’s service area genuinely changes.
- Schedule cadence. Monthly is the baseline for most accounts; move to weekly during a launch, a website migration, or an active link-building push.
- Run QA on every scan. Log the exact time of day, note which competitors occupy each cell, and archive the heatmap image alongside the raw data export.
Pro Tip: Keep a single shared spreadsheet across all client grids logging scan date, time of day, and grid parameters. It takes five minutes a month and saves you from ever explaining to a client why last quarter’s “decline” was actually just a Tuesday-versus-Saturday comparison error.
Changing grid spacing or the center point between runs makes month-over-month comparison meaningless, which is the single most common mistake agencies make when they’re managing a dozen grids at once.
Turning Geogrid Data Into a Report Clients Actually Read
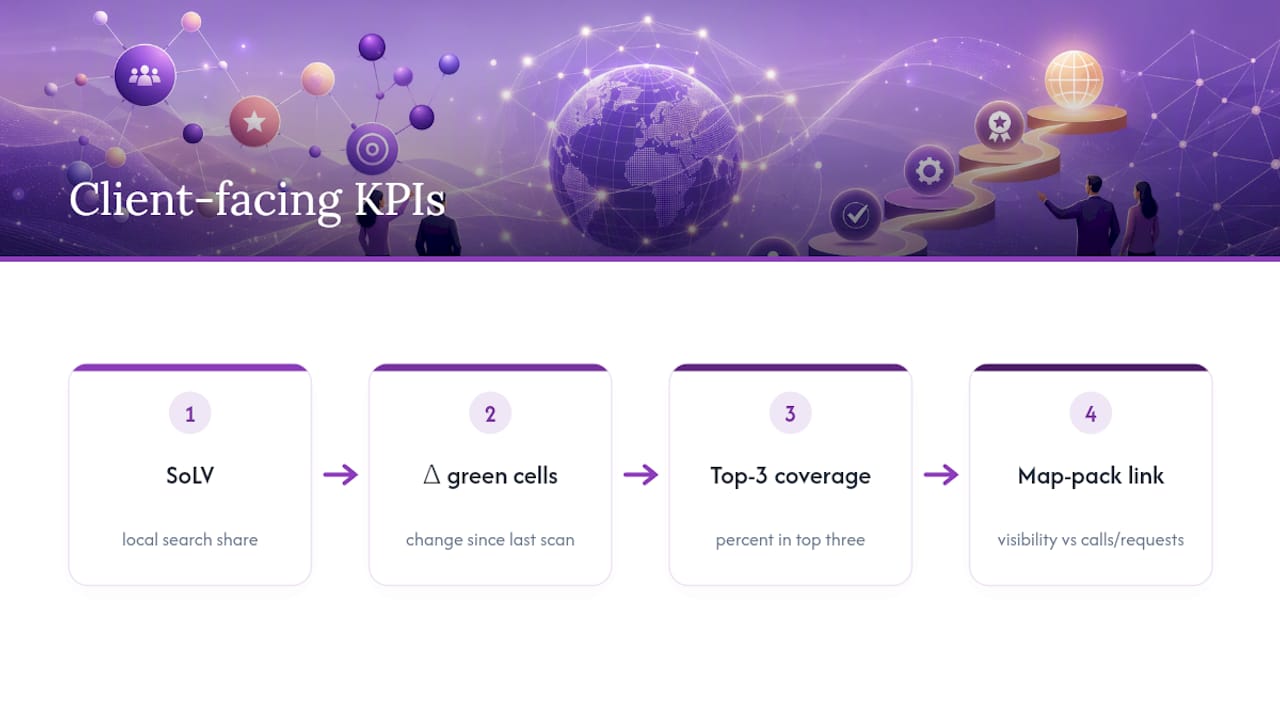
The KPIs that matter to a client aren’t the ones that matter to you internally. Lead with SoLV, the delta in green-area cells since the last scan, percentage top-3 coverage, and, where you can pull the data, a correlation between map-pack visibility and actual calls or direction requests.
Build the report around three assets: an annotated heatmap comparing this month to last, a clear before-and-after snapshot of the specific cells that moved, and a short prioritized action list tied to the yellow zones you found. Structure the narrative the same way this article opened: state the bottom line first, walk through the diagnosis, list the next steps, then set expectations for what those steps should produce.
White-labeling matters more than most agencies admit up front. A report that shows up in the agency’s own branding, exportable as a PDF or embeddable in a client portal, reads as a proprietary insight. The same data delivered on a vendor’s logo reads as a tool subscription the client could cancel and buy themselves.
How Maprank Handles Grid Tracking for Agencies
Maprank builds around the exact workflow above: customizable scan grids from 3x3 up through metro-scale sizes, white-label reports that carry the agency’s own branding rather than a vendor logo, and unlimited businesses on every plan so a growing client roster never triggers a new pricing tier.
Pricing runs on transparent per-scan credits instead of per-location fees that complicate budgeting on some platforms. That structure matters most at the workflow stage covered earlier: setting cadence, choosing grid size, and running consistent QA all depend on knowing exactly what a scan costs before you run it, not after the invoice arrives. Agencies managing multiple clients across different grid sizes get one predictable line item instead of a bill that scales unpredictably with account count.
Common Problems That Break a Geogrid Program (and How to Fix Them)
The most common failure isn’t a bad tool. It’s inconsistent methodology that makes month-over-month data useless.
Timing drift tops the list. Scanning a grid at 9 a.m. one month and 4 p.m. the next introduces variance that has nothing to do with actual ranking changes, since local results shift throughout the day based on search volume and Google’s own caching behavior. Lock a scan window and stick to it.
Grid parameter creep is the second-most common issue. An agency expands a grid from 5x5 to 7x7 mid-quarter because a client asked about a new neighborhood, then can’t explain why the average rank suddenly dropped. It didn’t drop. The grid got bigger and picked up weaker cells that weren’t measured before.
SAB centroid confusion trips up service-area businesses constantly. Without a storefront to anchor the grid, agencies either guess at a center point or use the client’s mailing address, which may sit nowhere near the actual customer base. Calculate a real centroid from the service radius instead.

Credit exhaustion mid-cycle happens when an agency runs weekly scans across too many keywords without checking remaining balance, leaving no room to run the diagnostic scan a client actually asks for. Budget credits against your calendar, not just your enthusiasm.
Flat or declining SoLV despite content work usually points to a Google Business Profile issue, not a content issue. Pair grid data with GBP optimization work before assuming the content strategy failed.
Connecting Geogrid Data to the Rest of Your SEO Stack
A geogrid scan tells you where a business ranks. It doesn’t tell you why, and that’s where pairing it with other data sources turns a heatmap into a diagnosis.
Google Business Profile insights are the first stop. Reviews and NAP consistency explain a lot of the gap between a green cell and an actual phone call, since a business can dominate the map pack in a neighborhood and still convert poorly if its profile is thin or its listing details conflict across directories.
Google Analytics and call-tracking data close the loop the other direction. If SoLV climbs but calls and direction requests don’t follow, the problem usually sits on the website or the profile itself, not in the ranking algorithm. Cross-reference geogrid deltas against traffic-source data before recommending another round of citation building.
Rank tracking for non-local keywords rounds out the picture for hybrid businesses that sell both locally and online. A broader Google Maps rank tracker covering neighborhood-level results should sit alongside standard SERP tracking for any transactional keyword that has no local intent, since running a full geogrid on a keyword nobody searches locally just burns credits for no reason.
CRM and lead-source data is the piece agencies skip most often, and it’s the one clients care about most. Tagging leads by the neighborhood they came from and matching that against grid coverage turns an abstract ranking report into a revenue conversation, which is the report a client actually renews for.
What Actually Moves the Needle in a Geogrid Program
Most agencies treat geogrid data as a reporting exercise: run the scan, screenshot the heatmap, drop it in a deck. That undersells what the data is actually for. The real value sits in the yellow cells, and most agencies spend too little time there because green cells feel like proof of success and red cells feel like a problem for later.
The conventional advice to “track more keywords” is usually backwards. A tight grid on three to five high-intent keywords, scanned consistently, produces a far more actionable dataset than a sprawling grid tracking fifteen keywords inconsistently. Credit budgets are finite, and spreading them thin trades depth for a false sense of coverage.
The bigger failure is treating a geogrid scan as a monthly ritual instead of a diagnostic tool. A scan that never changes your next month’s task list isn’t earning its credit cost. If the yellow cells from last month are still yellow this month, the strategy didn’t fail. Nobody acted on the data.
Prioritize proximity cliffs first, pair every scan with a Google Business Profile check, and resist the urge to average anything. The map tells the story. The average just hides it.
— Local
Try Maprank to Run Your Next Geogrid Scan
Agencies juggling multiple clients don’t need another tool with per-location fees stacking up every time a new business gets added. Maprank runs on straightforward per-scan credits, offers plans inclusive of multiple businesses, and supports white-label reporting for client delivery.
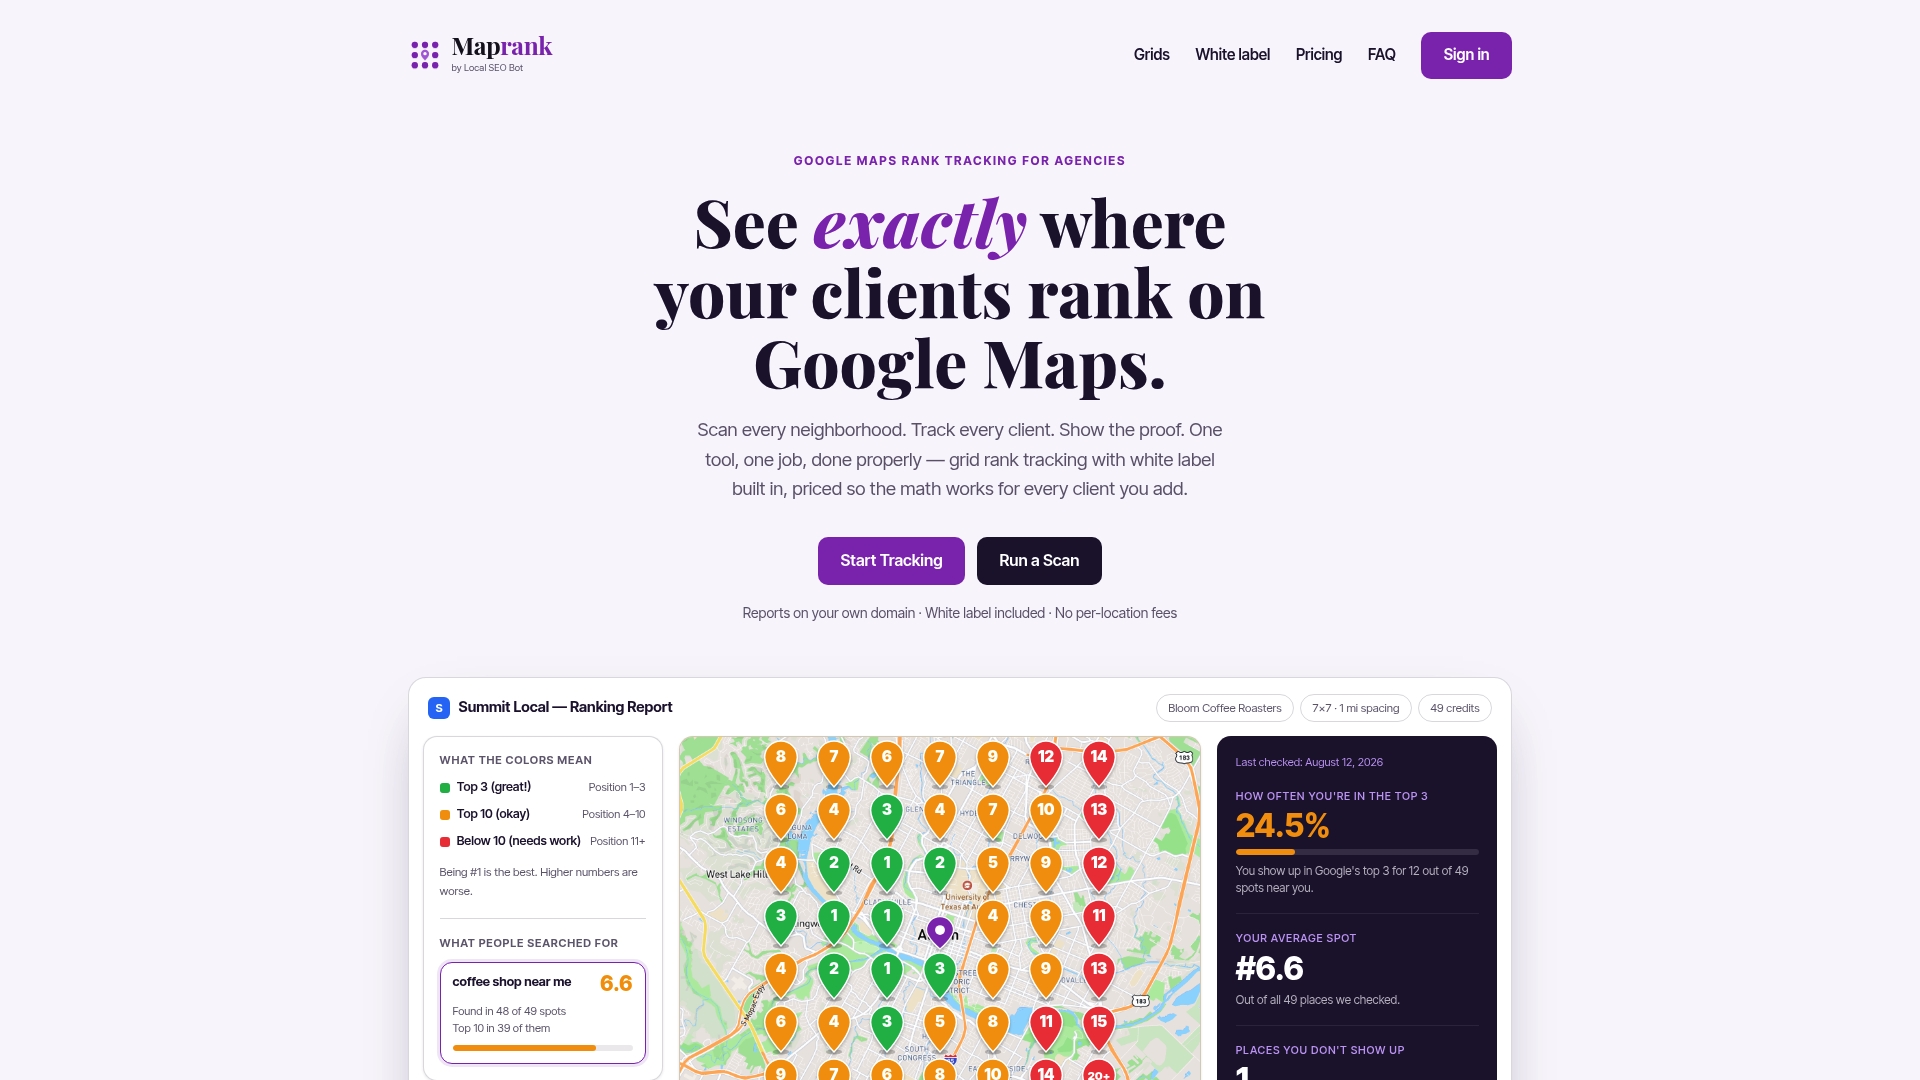
That combination solves the exact workflow gap covered above: consistent grid parameters, a predictable credit cost per scan, and a report that looks like it came from your agency, not a third-party dashboard. Set up a geo grid rank tracker for your first client account and run a 5x5 scan on their top money keywords to see the coverage map before your next check-in call. Compare the results against the best Google Maps rank trackers on the market if you want to see how the pricing and feature set stack up before committing.
Sources
- Geo Grid Rank Tracking: Definition, How It Works & 2026 Guide | theStacc
- Geogrid: Map Your Local Search Rankings Geographically | LocalSEOSkills