Run a 5x5 or 7x7 Scan: Google Maps Grid Workflow for Agencies
Run a 5x5 or 7x7 Scan: Google Maps Grid Workflow for Agencies
A Google Maps grid is grid-based rank tracking: a set of GPS points spread across a service area that each run the same search, exposing how visibility shifts block by block instead of showing one flattering number from the office address. For agencies onboarding a new client, the immediate move is a 5x5 or 7x7 scan centered on the business, run before you promise anything about rankings in the contract.
TL;DR:
- Grid tracking reveals localized ranking variations that single-point checks cannot, making it essential for multi-location and service-area businesses.
- Optimal grid sizes range from 3x3 for dense urban centers to 15x15 for extensive metro coverage, with spacing scaled to customer travel distances.
- Consistent, accurate scans require fixed grid configurations, same keyword groups, and geo-coded queries from actual coordinates to avoid misleading results.
- Reports should include average rank, top-3 share, visibility radius, and coverage percentage to better tie rankings to actual business outcomes.
- Agencies should automate scheduling, lock grid parameters, and preserve raw data to maintain reliable month-over-month comparisons and avoid common tracking pitfalls.
Table of Contents
- What Is Google Maps Grid Tracking, and Why Does It Matter for Agency Reporting?
- Choosing Grid Size, Spacing, and Scan Frequency by Client Type
- How to Run a Grid Scan Step by Step
- Metrics to Include in Client-Facing Grid Reports
- Turning Grid Results Into Neighborhood-Level Tactics
- What Maprank Brings to Grid-Based Rank Tracking
- How to Set Up and Manage Recurring Grid Scans Efficiently
- Common Pitfalls in Grid-Based Rank Tracking
- Agency Perspective: Reporting Changes When You Adopt Grid Tracking
- Run Your Next Grid Scan With Maprank
- Sources
What Is Google Maps Grid Tracking, and Why Does It Matter for Agency Reporting?
A grid scan runs the same search query from dozens of fixed coordinates spread across a city or service area, then plots the results as a color-coded heatmap showing exactly where a business lands in the local pack at each point, according to theStacc’s geo grid rank tracking guide. Green squares mean top-3 visibility. Red means the business barely shows up, even a mile from where it dominates.
This matters because Google itself lists proximity as one of three core local ranking signals, alongside relevance and prominence. A single rank check run from the business address measures the signal in its best possible light. It tells you nothing about the customer three neighborhoods over who never sees the listing at all.
Grid tracking earns its place in an agency’s toolkit for specific client situations:
- Multi-location businesses where a single check per city hides’ underperformance in one branch’s coverage zone.
- Service-area businesses (plumbers, movers, cleaners) with no fixed storefront but a defined delivery radius.
- Competitive urban markets where rankings can swing hard within a few blocks.
- New client onboarding, to set an honest baseline before you claim credit for anything.
A business can rank first at its own front door and disappear two blocks away. Grid data is the only way to catch that before a client does.
Choosing Grid Size, Spacing, and Scan Frequency by Client Type
Grid templates run from tight 3x3 scans up to sprawling 15x15 arrays, and the right choice depends entirely on how the client’s customers actually search. theStacc’s grid tracking guide recommends spacing points somewhere between 0.25 and 1.5 miles apart, scaled to the business type and how far people typically travel for it.
A few working templates:
- 3x3, tight spacing (0.25–0.5 mile): single-location businesses in dense urban cores, like a downtown coffee shop or a walk-in clinic.
- 5x5, moderate spacing (0.5–0.75 mile): the default for most local service businesses covering a city district.
- 7x7, wider spacing (0.75–1 mile): city-wide coverage for businesses pulling customers from an entire metro suburb.
- 9x9 to 15x15: multi-location brands or franchise groups that need a composite view across an entire metro area, built from several smaller grids stitched together.
Frequency should track how much is actually changing. Monthly scans are a reasonable baseline for most accounts, weekly scans earn their cost during an active optimization push (new citations, a review campaign, fresh location pages), and quarterly scans are enough for stable, mature accounts where rankings rarely move, a cadence theStacc’s guide backs up directly. Multi-location clients need their own grid per location, not one aggregated view, because averaging locations together can bury a weak branch inside a strong region’s numbers, as Lead Oracle’s agency reporting guide points out.
How to Run a Grid Scan Step by Step
Running a clean scan is mostly about discipline: same query, same points, same time window, every single time. Here’s the sequence that avoids the errors that quietly wreck month-over-month comparisons.
- Set the center point. Use the business’s actual GBP coordinates, not the city centroid, so the grid reflects real proximity.
- Choose grid dimensions and spacing based on the client type templates above, and lock them in writing so nobody “improves” the grid mid-campaign.
- Define keyword groups. Pick the two or three queries that map to actual revenue, not vanity terms, and keep the exact query string identical across every scan.
- Run geo-coded queries at every point, capturing the Map Pack position (not organic position) for each coordinate.
- Timestamp and archive every scan, including the raw point-level data, not just the heatmap image.
- Log Google Business Profile actions where available: calls, direction requests, website clicks, so ranking movement can sit next to actual business outcomes.
Do not run this manually in a regular browser tab and call it done. Incognito mode strips saved logins but does nothing about IP-based location signals or search history bleed, so it still tilts results toward wherever you happen to be sitting. Geo-coded queries sent from the actual target coordinates are the only way to remove that bias.
Pro Tip: Keep a locked spreadsheet or database record of every grid’s exact coordinates and spacing before the first scan. If a client asks for the grid to “cover a bit more area” six months in, you need the original grid preserved separately, or your month-over-month comparison becomes meaningless.
Metrics to Include in Client-Facing Grid Reports
A grid report that shows one number is barely better than the single-point check it replaced. The minimum set worth reporting:
- Average Map Rank (AMR): the mean position across every point in the grid, the single number that best summarizes overall footprint.
- Top-3 share: the percentage of grid points where the business lands in the map pack’s top three, the metric clients actually feel in their phone ringing.
- Visibility radius: roughly how far from the business location the client still shows up competitively, useful for service-area businesses quoting travel distance.
- Grid coverage percentage: the share of points where the business appears at all versus points where it’s invisible.
Reports built around geo-grid metrics like these do a better job tying ranking movement to leads and profile actions than a single tracked keyword ever can, according to Diakachimba’s local SEO reporting guide. It’s worth separating Map Pack position from localized organic rankings in the same report, since a business can dominate the map pack while barely appearing in organic local results, or the reverse.
On visuals: a full-area heatmap for the current period, a month-over-month diff map showing exactly which zones improved or slipped, and a point-level table for the two or three neighborhoods the client cares most about. Where the data exists, lay Google Business Profile actions (calls, direction requests) directly next to the grid trend line so the client sees ranking and business impact on the same page.
Turning Grid Results Into Neighborhood-Level Tactics
A heatmap is only useful once someone reads the pattern and assigns work to it. Solid red pockets usually mean an established competitor with years of reviews and citations sitting on that neighborhood. Those are expensive to dislodge and rarely worth a full-scale assault unless the client has real budget for it.
Yellow rings, the zones sitting at positions 4 through 7, are the opposite story. These near-miss areas are often one push away from the top 3, and a focused local review campaign or a dedicated neighborhood landing page frequently moves them in, a pattern theStacc’s guide calls out as one of the fastest wins available in grid data.
A rough playbook by pattern:
- Red pockets: deprioritize unless the client specifically wants that neighborhood; the cost per point gained is usually too high.
- Yellow rings (positions 4–7): target with review acquisition, service-area page content, and citation cleanup.
- Green expansion at the edges: push paid geo-targeting or hyperlocal content into the adjacent grid points to extend the boundary outward.
Pro Tip: When a client asks why you’re not attacking a solid red zone, show them the grid. A visual of a decade-old competitor with 400 reviews sitting on that block explains the budget conversation better than any paragraph you could write.
What Maprank Brings to Grid-Based Rank Tracking
Maprank builds directly around the workflow above: customizable scan grids in the 3x3 to 15x15 range, white-label reports that go out under your agency’s own branding, and unlimited businesses on its plans so a growing client roster doesn’t trigger new per-location fees. There’s no Google account integration requirement, which removes a common access headache when onboarding a new client fast.
Pricing runs on a straightforward per-scan credit model rather than tiered, per-location markups seen in some rank trackers, so your cost scales with actual usage instead of client count. Agencies using Maprank’s Google Maps rank tracker get a grid built specifically for the reporting structure covered above: AMR, top-3 share, and neighborhood-level heatmaps ready for client delivery.
How to Set Up and Manage Recurring Grid Scans Efficiently
The failure mode most agencies hit isn’t setting up the first grid scan. It’s keeping thirty client grids running on schedule six months later without someone forgetting a scan or, worse, quietly changing a grid’s spacing mid-campaign.
Start by locking each client’s grid configuration (center point, dimensions, spacing, keyword list) into a permanent record the moment it’s approved. Treat that configuration as fixed unless the client’s service area genuinely changes, because a resized grid breaks every historical comparison you’ve built.
Batch scans by cadence tier rather than by client name. Group your monthly-baseline accounts into one scheduling block, your active-campaign weekly accounts into another, and your quarterly stable accounts into a third. This turns “did I run everyone’s scan this week” into a checklist against three lists instead of thirty individual reminders.
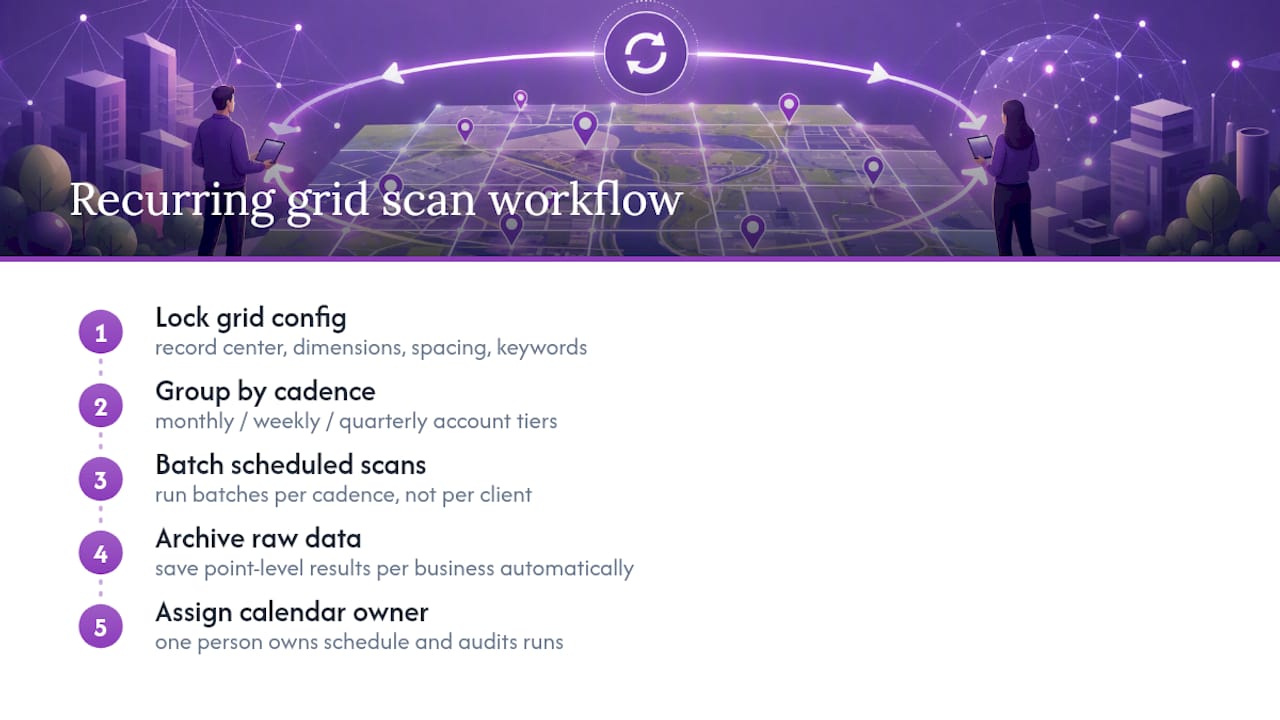
Automate the archive step. Every scan should save its raw point-level data automatically, not just a screenshot of the heatmap, because the diff map you build for next month’s report depends on having last month’s exact numbers, not a memory of what the colors looked like. A tool like Maprank handles this by storing scan history per business so agencies can pull month-over-month comparisons without rebuilding spreadsheets by hand.
Finally, assign one person to own the scan calendar across the whole client roster. Grid tracking fails quietly, a missed scan doesn’t throw an error, it just leaves a gap in the report nobody notices until the client asks why last month’s data is missing.
Common Pitfalls in Grid-Based Rank Tracking
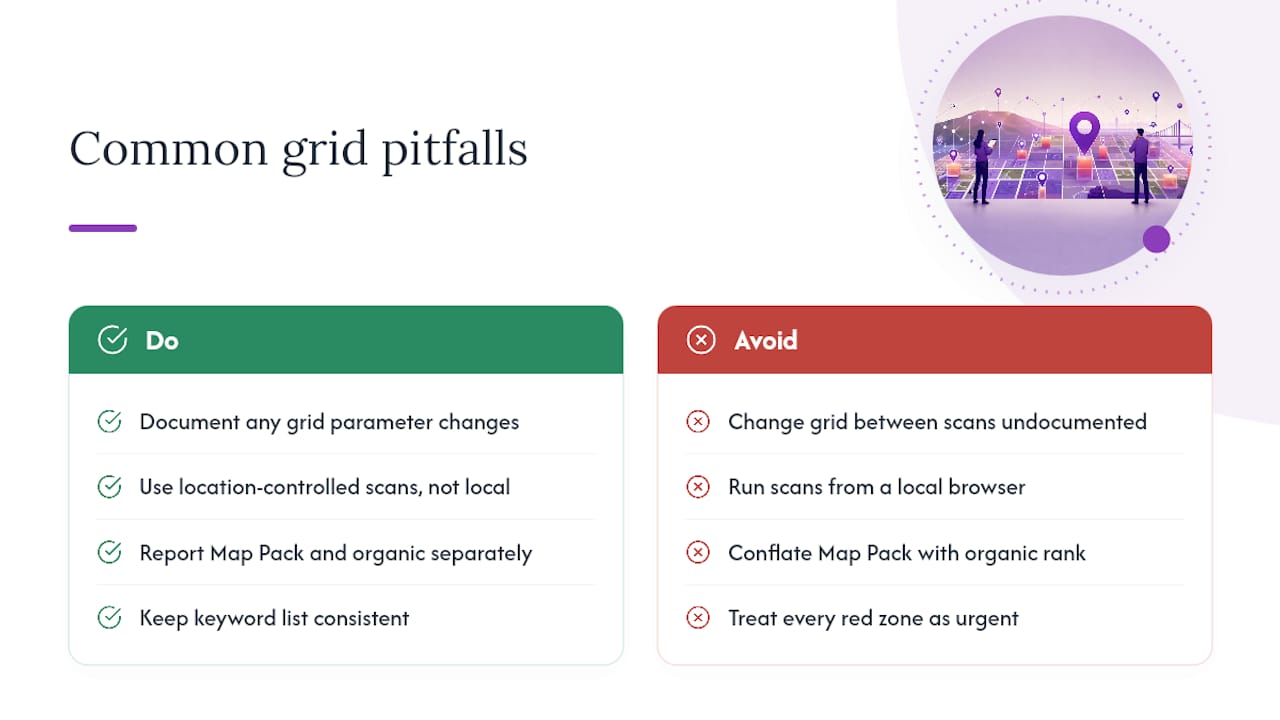
The single most damaging mistake is changing grid parameters between scans without documenting it. Widen the spacing, move the center point, or add a ring of points, and you’ve broken the comparison to every prior scan. The heatmap will show “improvement” that’s really just a smaller grid measuring a smaller area.
Running scans from a regular browser, even in incognito mode, is another recurring error. Incognito clears cookies and saved searches, but it does nothing about the IP-based location Google infers from your actual internet connection, so results still skew toward wherever the person running the scan happens to be sitting rather than the target coordinates.
Comparing Map Pack rank to organic rank as though they’re the same metric confuses clients and sometimes the agency doing the reporting. A business can hold position two in the map pack while sitting on page three organically for the identical query; report them separately.
Ignoring keyword consistency is a quieter version of the same problem. Swapping “plumber near me” for “emergency plumber” between scan cycles introduces noise that looks like ranking volatility but is actually just a different search.
Last, treating every red zone as a fire that needs immediate attention burns budget for no return. Some neighborhoods belong to an entrenched competitor with a decade of reviews behind them, and the honest move is to tell the client that directly rather than promise movement a scan or two of extra content won’t deliver.
Agency Perspective: Reporting Changes When You Adopt Grid Tracking
Once an agency switches to grid reporting, the monthly call changes shape. Instead of defending one rank number that moved up two spots or down one, you’re showing a map with green expanding outward from last month’s boundary, a visual client understand instantly without any SEO vocabulary. Reports built around coverage expansion rather than a single tracked term tend to hold client attention longer and support retainer conversations better, and that pattern holds up across the agency reporting research on what actually keeps clients engaged.
The bigger shift is internal. Agencies stop chasing one keyword’s rank and start building neighborhood playbooks, deciding which zones get review pushes, which get new location pages, and which get left alone because the cost of competing there doesn’t pencil out.
— Local
Run Your Next Grid Scan With Maprank
Maprank turns everything in this guide into a workflow instead of a spreadsheet: pick a grid template, set your spacing, and get a white-label heatmap report ready to send under your own agency’s name, with no per-location surcharge stacking up as your client list grows.
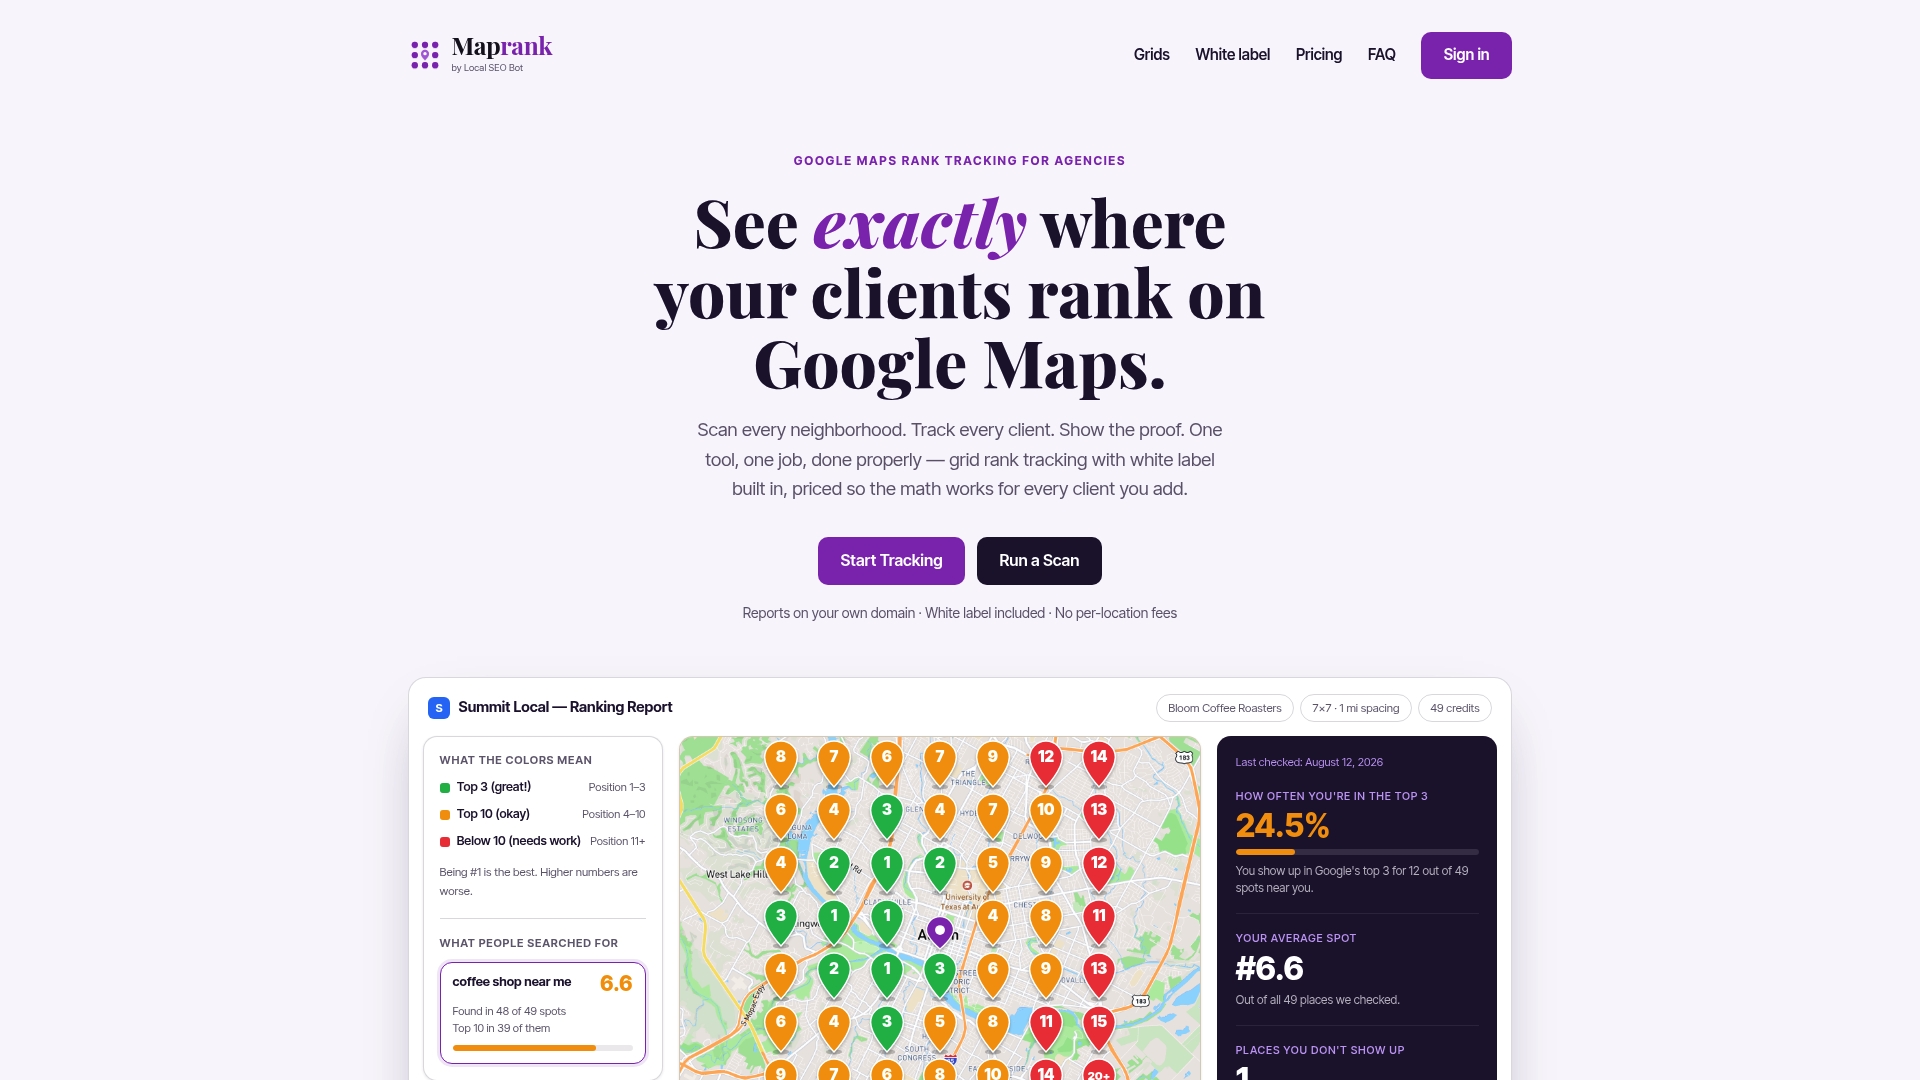
If you’re still deciding between tools, the comparison of Google Maps rank trackers breaks down grid features side by side. For agencies ready to move, the local SEO rank tracker page walks through white-label setup, and the Maprank homepage has current pricing and a way to start scanning your first client grid today.
Sources
Google’s own ranking documentation confirms proximity as a core local ranking factor, the reason single-point checks miss so much. theStacc’s geo grid glossary entry lays out grid templates and spacing math in detail. Diakachimba’s reporting guide covers the metrics clients actually respond to, and Lead Oracle’s agency guide makes the case for per-location grids on multi-location accounts.
- About Google My Business (Google Business Profile) ranking
- Geo Grid Rank Tracking: Definition, How It Works & 2026 Guide | theStacc Glossary
- Google Maps Ranking Report for Agencies (2026) | Lead Oracle AI Blog