Agencies: Run a 25–49 Point Local SEO Heatmap to Prove Progress
Agencies: Run a 25–49 Point Local SEO Heatmap to Prove Progress
A local SEO heatmap is a color-coded grid overlay on Google Maps that shows exactly where your business ranks across dozens or hundreds of nearby points, not just the one spot where you typed a search. The core benefit is simple: it exposes block-by-block visibility gaps that a single rank check always misses. Run a first scan, export the map, and hand a client a picture worth more than any spreadsheet.
TL;DR:
- Heatmaps reveal visibility gaps block-by-block that rank checks often miss, highlighting opportunities for targeted improvements in local SEO.
- High-density scans provide street-level detail crucial for fast-changing urban markets, while rural areas may only need moderate density.
- Comparing before-and-after heatmaps demonstrates whether specific fixes, such as category or review updates, effectively improve local rankings.
- Red zones surrounded by green indicate local issues like stronger competitors or content gaps, guiding prioritized action steps.
- Agencies should seek heatmap tools with white-label reports, unlimited business tracking, customizable grids, saved history, and transparent pricing to scale efficiently.
Table of Contents
- What Does a Local SEO Heatmap Actually Show You?
- How Grid Scans Work: Center, Shape, and Density
- Why Heatmaps Change What Agencies Actually Do
- Reading the Map: Turning Color Patterns Into a Plan
- Running Your First Heatmap Scan: A Practical Checklist
- What Agencies Should Demand From Any Heatmap Tool
- An Agency Take: Why the Demo Sells Better Than the Pitch
- Get a Clear Picture of Your Map Rankings Right Now
- Sources
What Does a Local SEO Heatmap Actually Show You?
Each colored dot on a local SEO heatmap represents a simulated search performed from that exact geographic point, not from your business address. Click any point and you get the ranking position your Google Business Profile held there, plus the businesses that outranked you.
Color bands make the pattern readable at a glance:
- Green (top 3): you’re winning the map pack from that location.
- Yellow (positions 4 to 7): visible, but buried below the fold on mobile.
- Orange (positions 8 to 19): technically ranked, practically invisible.
- Red (absent or 20+): you don’t exist there as far as Google Maps searchers are concerned.
Most tools let you export the finished grid as a PDF map for client decks, a raw cell table for analysis, or a CSV for anyone who wants to build their own pivot tables. The visual itself tends to do more convincing than the raw numbers ever could.
How Grid Scans Work: Center, Shape, and Density
Every scan starts with three decisions: where the grid centers, what shape it takes, and how many points you place inside it.
- Pick your center point. Usually your storefront or the middle of your service area.
- Choose a shape. A radius grid works for a business with one location and a roughly circular draw area. A polygon grid fits businesses with an irregular service boundary, like a plumber who covers three towns but skips the lake district between them, since it lets you exclude areas you don’t actually serve.
- Set your density. Common tiers run from a lean 9 or 25 point grid up to a high-density grid for dense urban cores.
Each point in the grid triggers its own independent Maps search, which is why density and cost move together. A very high-density scan gives you street-level resolution, but it also burns through scan credits far faster than a low-density check.
Pro Tip: Match density to how fast rankings actually shift in that market. A downtown restaurant district can flip visibility every few blocks, so it earns the higher density. A rural service business covering a wide area rarely needs more than a low to moderate density grid to see the real picture.
Why Heatmaps Change What Agencies Actually Do
A heatmap earns its place in an agency’s toolkit the moment a client asks “what am I actually paying for?” Instead of describing progress, you show it.
- Retention leverage. A side-by-side comparison of a red zone turning green over a quarter is the single most persuasive artifact in a renewal conversation.
- Diagnosis, not guessing. A business that fades as distance from its storefront increases has a proximity problem; a business that’s strong citywide but dead in one specific ZIP code has a relevance or competition problem in that pocket.
- Multi-location planning. Franchises and multi-unit brands use overlapping grids to spot cannibalization between their own locations and to find whitespace before opening a new site.
The visual nature of the map is what actually lands with clients who don’t read algorithm updates. Watching a cluster of red dots shift to green connects your invoice to something they can see with their own eyes.
Reading the Map: Turning Color Patterns Into a Plan
Not every red zone means the same thing, and treating them identically wastes budget.
A gradual color fade as you move outward from your storefront is normal physics: Google weights proximity, and no amount of optimization erases distance. But an isolated red or orange patch inside your service area, surrounded by green, signals something local and fixable, whether that’s a competitor with stronger reviews in that specific neighborhood or a content gap for a service that pocket searches for by name.
Click into any weak cell and study who’s actually beating you there. Their Google Business Profile categories, review count, and whether they run a dedicated landing page for that neighborhood usually explain the gap faster than any audit checklist.
From there, prioritize in three tiers:
- This week: GBP category fixes, photo updates, and a targeted review request push in the weak cells.
- This quarter: a dedicated landing page for the neighborhood or service that keeps showing up red.
- This year: local content and citation building aimed specifically at the ZIP codes that never turn green.
Pro Tip: Save every scan before you make changes. Comparing a “before” grid to an “after” grid two months later is the only way to prove a specific fix actually moved the needle, rather than assuming it did.
Running Your First Heatmap Scan: A Practical Checklist
- Pick the keyword that matters most, usually the client’s primary service plus their category, not a branded term.
- Set the center on the actual business address or, for service-area businesses, the geographic middle of the coverage zone.
- Choose radius or polygon based on whether the service area is roughly circular or irregular.
- Start with moderate density, around 25 to 49 points, for a first pass. You can always scale up once you see where the interesting cells are.
- Save the scan immediately after it completes so it becomes your baseline for every future comparison.
- Export a client-friendly version, a clean PDF map with a short written summary of the two or three biggest findings.
Rescan regularly for active campaigns and less frequently for stable accounts. The value compounds: a single scan is a snapshot, but three or four saved scans over time become the story that actually keeps a client renewing.
What Agencies Should Demand From Any Heatmap Tool
Not every rank tracker is built for agency life, and the wrong one turns reporting into a part-time job. A few features separate tools worth paying for from ones that create more work than they save.
- White-label reporting on your own domain, not a vendor’s branding, so clients see your agency’s name on every export.
- Unlimited businesses on one plan, since per-location fees punish exactly the agencies scaling fastest.
- Flexible grid shapes and density, so a single-location shop and a five-city franchise both get an appropriately sized scan.
- Saved scan history for genuine before-and-after comparisons, not just a one-time snapshot.
- Transparent, predictable pricing based on scan credits rather than a maze of per-client add-ons.
Maprank builds around exactly this list, which is worth checking against whatever tool currently sits in your stack.
An Agency Take: Why the Demo Sells Better Than the Pitch
Nothing closes a prospect faster than pulling up their address live and watching the grid render in real time. Show them the red cells first, then the two or three quick fixes that would flip them green. Package that same map into their first monthly report, and the retainer conversation basically writes itself.
— Local
Get a Clear Picture of Your Map Rankings Right Now
There are alternatives to juggling per-location fees and clunky Google account integrations: some tools offer customizable scan grids, white-label reports on your own domain, unlimited businesses, and pricing that scales by scan credits instead of by client count.
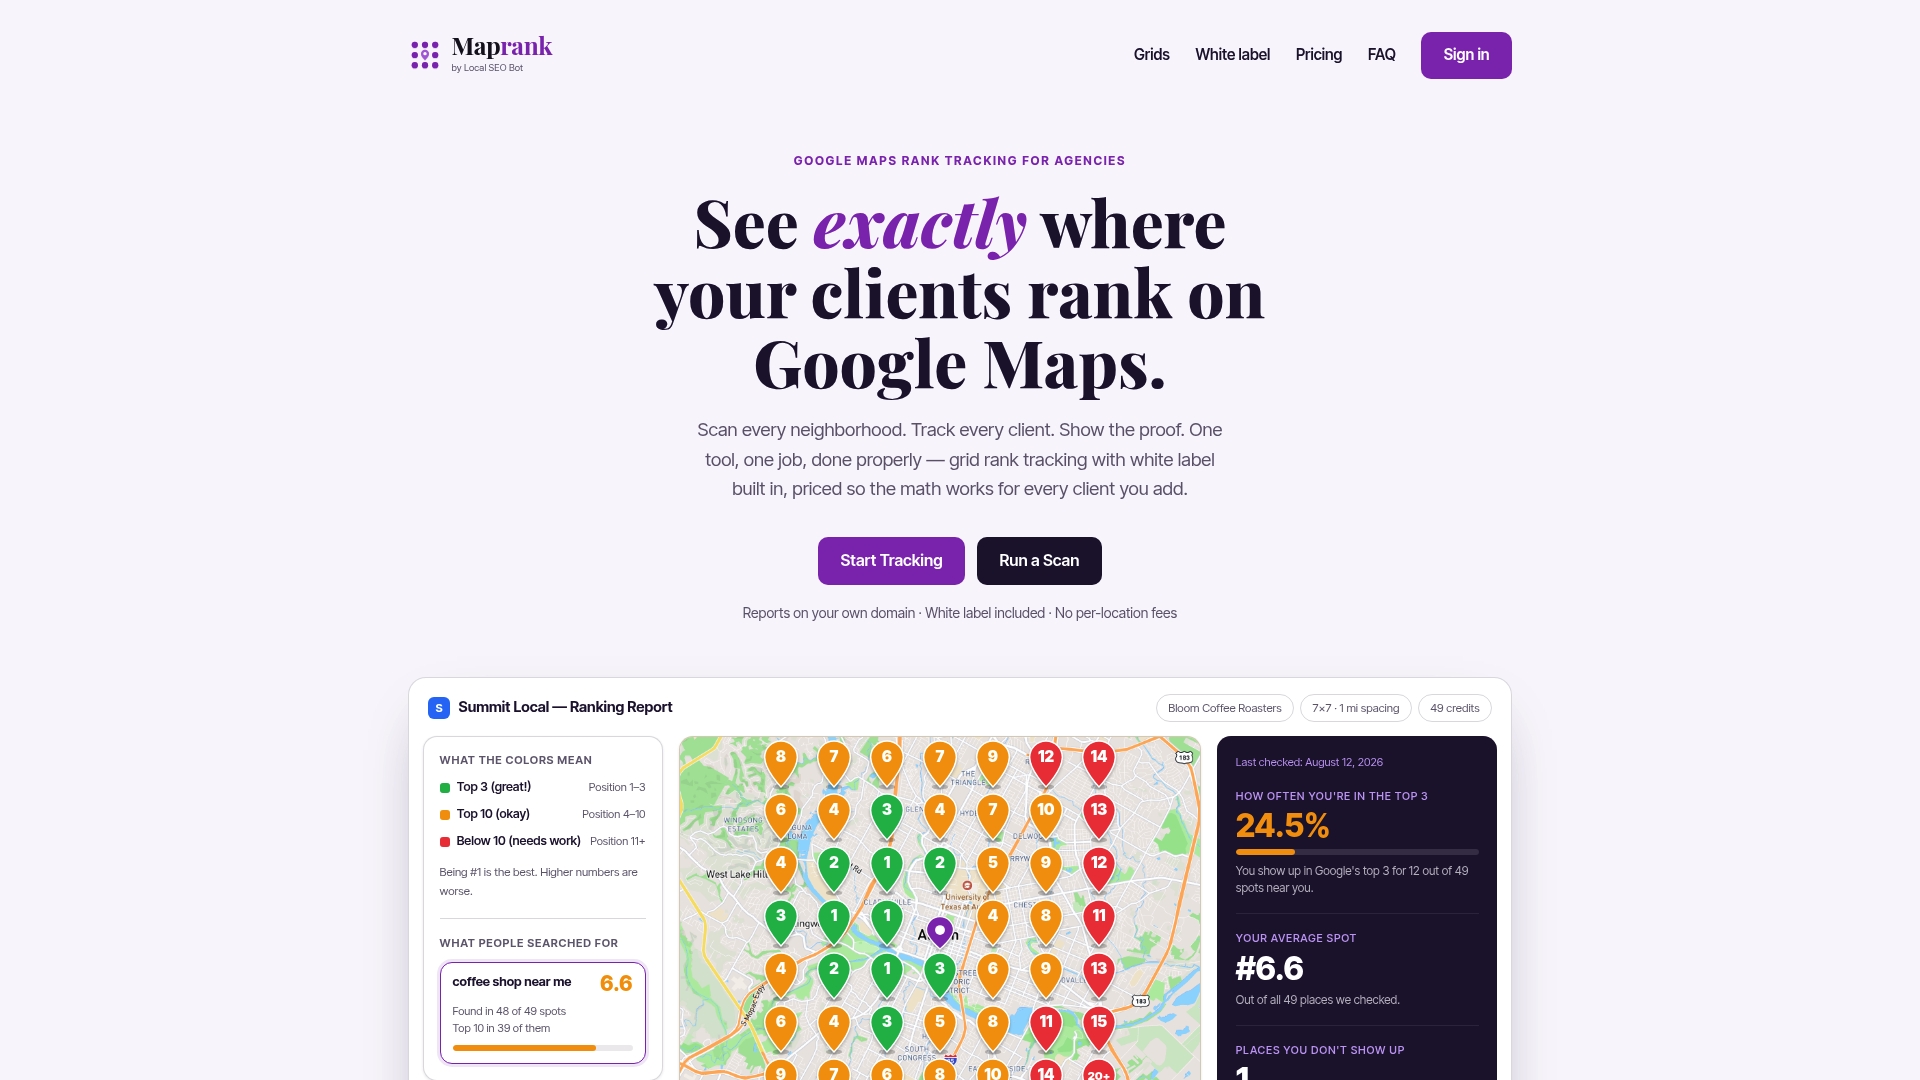
That structure matters most for agencies managing several clients at once, since a pricing model built around per-location charges punishes exactly the growth you’re trying to create. Run a free demo scan on the Google Maps rank tracker using a small 3x3 grid around a client’s address, and you’ll see the visibility gaps before the call even ends. If white-label reporting is the deciding factor for your agency, the local SEO rank tracker page breaks down exactly what ships on every plan. Start a scan today and bring the map to your next client meeting.