No GBP Login Required: Local SEO Report Template for Agencies
No GBP Login Required: Local SEO Report Template for Agencies

Start with a Looker Studio executive dashboard backed by a Google Sheets appendix, plus a one-page PDF summary for email. The dashboard should prove local leads and listing actions (calls, direction requests, booking clicks), not raw traffic or vanity impressions. For the ranking data feeding it, an agency-ready grid export, the kind Maprank produces without needing Google account access, gives you the geographic detail clients actually care about.
TL;DR:
- Local SEO reports should focus on map visibility, listing actions, and service page performance to measure meaningful customer engagement.
- Use three main formats: Looker Studio dashboards for real-time access, Google Sheets for raw data, and PDFs for quick summaries to suit different client needs.
- Building a standardized, system-based report process reduces monthly workload and ensures consistency, with automation and clear KPI definitions essential.
- Grid sampling exposes coverage gaps and neighborhood-level ranking insights, clarifying why rankings change beyond just position fluctuations.
- Maprank offers a frictionless, unlimited grid rank tracking solution that requires no Google account access, simplifying onboarding for multi-location clients.
Table of Contents
- What Should a Local SEO Report Include?
- Which Templates and File Formats Actually Work?
- How Do You Build a Reproducible Local SEO Report?
- What Fields Belong in a Sample Report Layout?
- How Often Should You Report, and What Should You Charge?
- Why Grid Tracking Changes What a Local Report Can Prove
- What the Data Actually Says About Good Local Reporting
- Getting Started With Maprank
- Templates and Guides Worth Bookmarking
- Sources
- FAQ
What Should a Local SEO Report Include?
A local SEO report exists to answer one question for the client: is the business showing up where and when it matters? That means the metrics have to reflect visibility in specific neighborhoods and actions taken from that visibility, not just aggregate traffic. Two Minute Reports recommends going further in 2026 and tracking AI discovery and Google Business Profile health alongside the traditional metrics, since AI-driven search surfaces are pulling a growing share of local queries away from the classic ten blue links.
Here’s the priority order that actually holds up in client meetings:
- Map and listing visibility: map-pack impressions, map-pack presence rate, and sampled grid visibility across the service area.
- Listing actions: phone calls, website clicks, direction requests, and booking clicks straight from the Google Business Profile.
- Service-page performance: impressions, clicks, click-through rate, and conversions attributed to individual service pages.
- Local keyword ranks: sampled by grid point or representative location, always shown with change context rather than a static snapshot.
- Reputation signals: review count, rating trend over time, and a couple of highlighted reviews that give the numbers a human face.
- Data-quality notes: the reporting period, device type, sampling method, and any known attribution gaps.
That last bullet gets skipped constantly, and it’s the one that saves you an awkward call later.
Statistic to keep in mind: Porter Metrics specifically recommends pairing click-through rate and conversion rate with cost per conversion in local dashboards, because rank alone tells a client almost nothing about revenue impact.
Which Templates and File Formats Actually Work?
Three formats cover almost every client scenario, and each does a different job.
- Looker Studio dashboards work best for live, interactive client access. They pull from connected sources automatically, refresh on a schedule, and let you set view-only permissions so clients can’t touch the underlying data.
- Google Sheets functions as your canonical export layer. This is where raw pulls from Search Console, call tracking, and rank grids land before anything gets visualized, and it doubles as your monthly snapshot archive.
- PDF or slide one-pagers are for busy stakeholders who want the headline, not the dashboard. These get emailed or dropped into renewal proposals.
Whatagraph publishes a free local SEO report template that blends SEO metrics with conversion data in one plug-and-play layout, a decent starting point if you’re building your first client-facing version. Template offers an editable version covering keyword analysis, GBP audit fields, citations, and competitor tracking that you can adapt by vertical in a browser without touching design software.
The main dashboard should hold only the metrics a client will act on. Push raw keyword tables, full GBP exports, and connector logs into an appendix tab. Nobody wants to scroll past forty rows of grid coordinates to find out whether calls went up.
How Do You Build a Reproducible Local SEO Report?
A report you rebuild from scratch every month is a report you’ll eventually stop sending. Build it once as a system, and the monthly version becomes an update, not a project.
- Define the audience and the outcome first. An owner wants three numbers and a verdict. An in-house marketing manager wants channel-level detail. Decide which one you’re building for before you touch a KPI list.
- Connect your data sources. Google Business Profile, Search Console, Analytics, call-tracking software, and your rank grid export all need a stable connection or a repeatable manual pull.
- Standardize the exports in Google Sheets. Document the sampling method and timestamp for every pull. This is what saves you when a client questions a number six months from now.
- Design the dashboard in three layers: a top-line summary, evidence panels for each KPI category, and an appendix for anyone who wants the raw data.
- Write commentary that ties every notable move to a specific action you took (or recommend), and assign a next step. A number with no explanation invites doubt.
- Automate the exports, schedule distribution, and run a short verification checklist before anything goes out the door.
Pro Tip: Keep a running “known issues” note in your Sheets appendix, things like a tracking gap during a GBP suspension or a call-tracking number swap. Referencing it later takes thirty seconds and prevents a much longer email thread.
What Fields Belong in a Sample Report Layout?
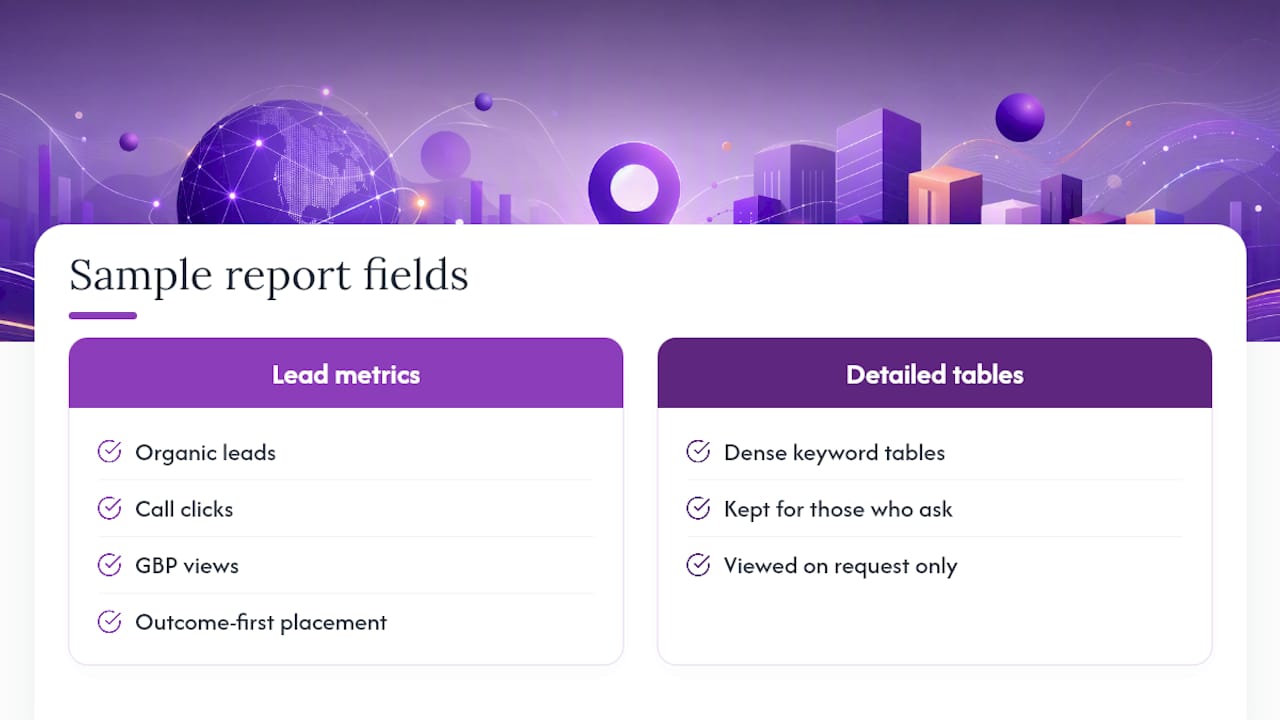
A field map turns “build a report” into “fill in these boxes,” which is the difference between a template that gets used and one that sits in a shared drive untouched.
SEOReportKit’s sample local-service report follows this same logic: lead with outcomes like organic leads, call clicks, and GBP views, and keep the dense keyword tables where only someone who asks for them will look.
How Often Should You Report, and What Should You Charge?
Monthly is the working baseline for almost every client relationship, with a quarterly review layered on top for the strategic conversation, not just the numbers. Weekly checks only make sense during a launch, a penalty recovery, or a campaign push, since local rankings rarely move fast enough to justify weekly noise.
- Setup: expect several hours to connect sources, build the template, and get client sign-off on KPI definitions.
- Monthly maintenance: usually one to three hours for data checks and commentary once the connectors are stable.
- Pricing models: a one-time setup fee plus a monthly retainer, or reporting bundled into existing SEO packages using credit-based scan allowances.
- Comparison baseline: always report against the same prior period (month over month and year over year) so a seasonal dip doesn’t read as a failure.
A number worth building your pricing story around: Porter Metrics notes that connector-ready template stacks, Looker Studio paired with verified Sheets exports, cut setup time noticeably compared to manual rebuilds, which is exactly the efficiency you can point to when justifying a retainer over hourly billing.
Why Grid Tracking Changes What a Local Report Can Prove
A single “where do we rank” check tells you almost nothing about a service-area business, because rank shifts by neighborhood, sometimes block by block. Grid sampling checks dozens of points across a service area and shows coverage the way a customer actually experiences it: strong three miles from the shop, invisible past the highway.
- Customizable scan grids let you match sampling density to how spread out a client’s service area actually is.
- Unlimited businesses on a single plan matter once you’re managing more than a handful of client accounts.
- White-label exports mean the report carries the agency’s brand, not the tool’s.
- No Google Business Profile integration requirement removes a login-permission headache that trips up a lot of client onboarding.
Agencies turn these grid exports into client narratives fast: a coverage gap on the west side of town, a priority neighborhood worth a citation push, or a seasonal dip that maps to a competitor’s ad spend. Grid data gives you the “why,” not just the “what.”
Pro Tip: When a client asks why their rank “dropped,” pull up the grid map before you touch keyword data. Nine times out of ten it’s a coverage story, not a ranking algorithm story.

What the Data Actually Says About Good Local Reporting
Most local SEO reports fail for the same boring reason: they lead with what’s easy to pull instead of what the client actually asked for. Rank tables are easy to export and hard to act on. Calls, direction requests, and booking clicks are harder to wire up correctly but are exactly what a business owner is trying to grow.
The conventional advice, “just show them where you rank”, falls short because rank is a proxy, not an outcome. A business ranking third for a high-intent term with strong call volume is in better shape than one ranking first with no listing actions at all. If the industry spent less time worshipping position-one screenshots and more time on attribution notes and grid coverage maps, client retention conversations would be a lot shorter and a lot less defensive.
Where I’d tell any agency to start: build the field map before you pick a dashboard tool. Decide what “current,” “previous,” and “attribution note” mean for your reporting before you open Looker Studio. Grid-based visibility data, the kind that shows coverage gaps by neighborhood, deserves a permanent spot in that field map, because it explains movement that keyword-position tables alone never will.
— Local
Getting Started With Maprank
Maprank is the alternative to juggling a dozen per-location rank-tracking fees, one flat, transparent pricing structure that scans a full grid across a client’s service area without ever asking for their Google account credentials. That single difference, no integration friction, removes one of the most common onboarding delays agencies run into when adding a new client mid-month.
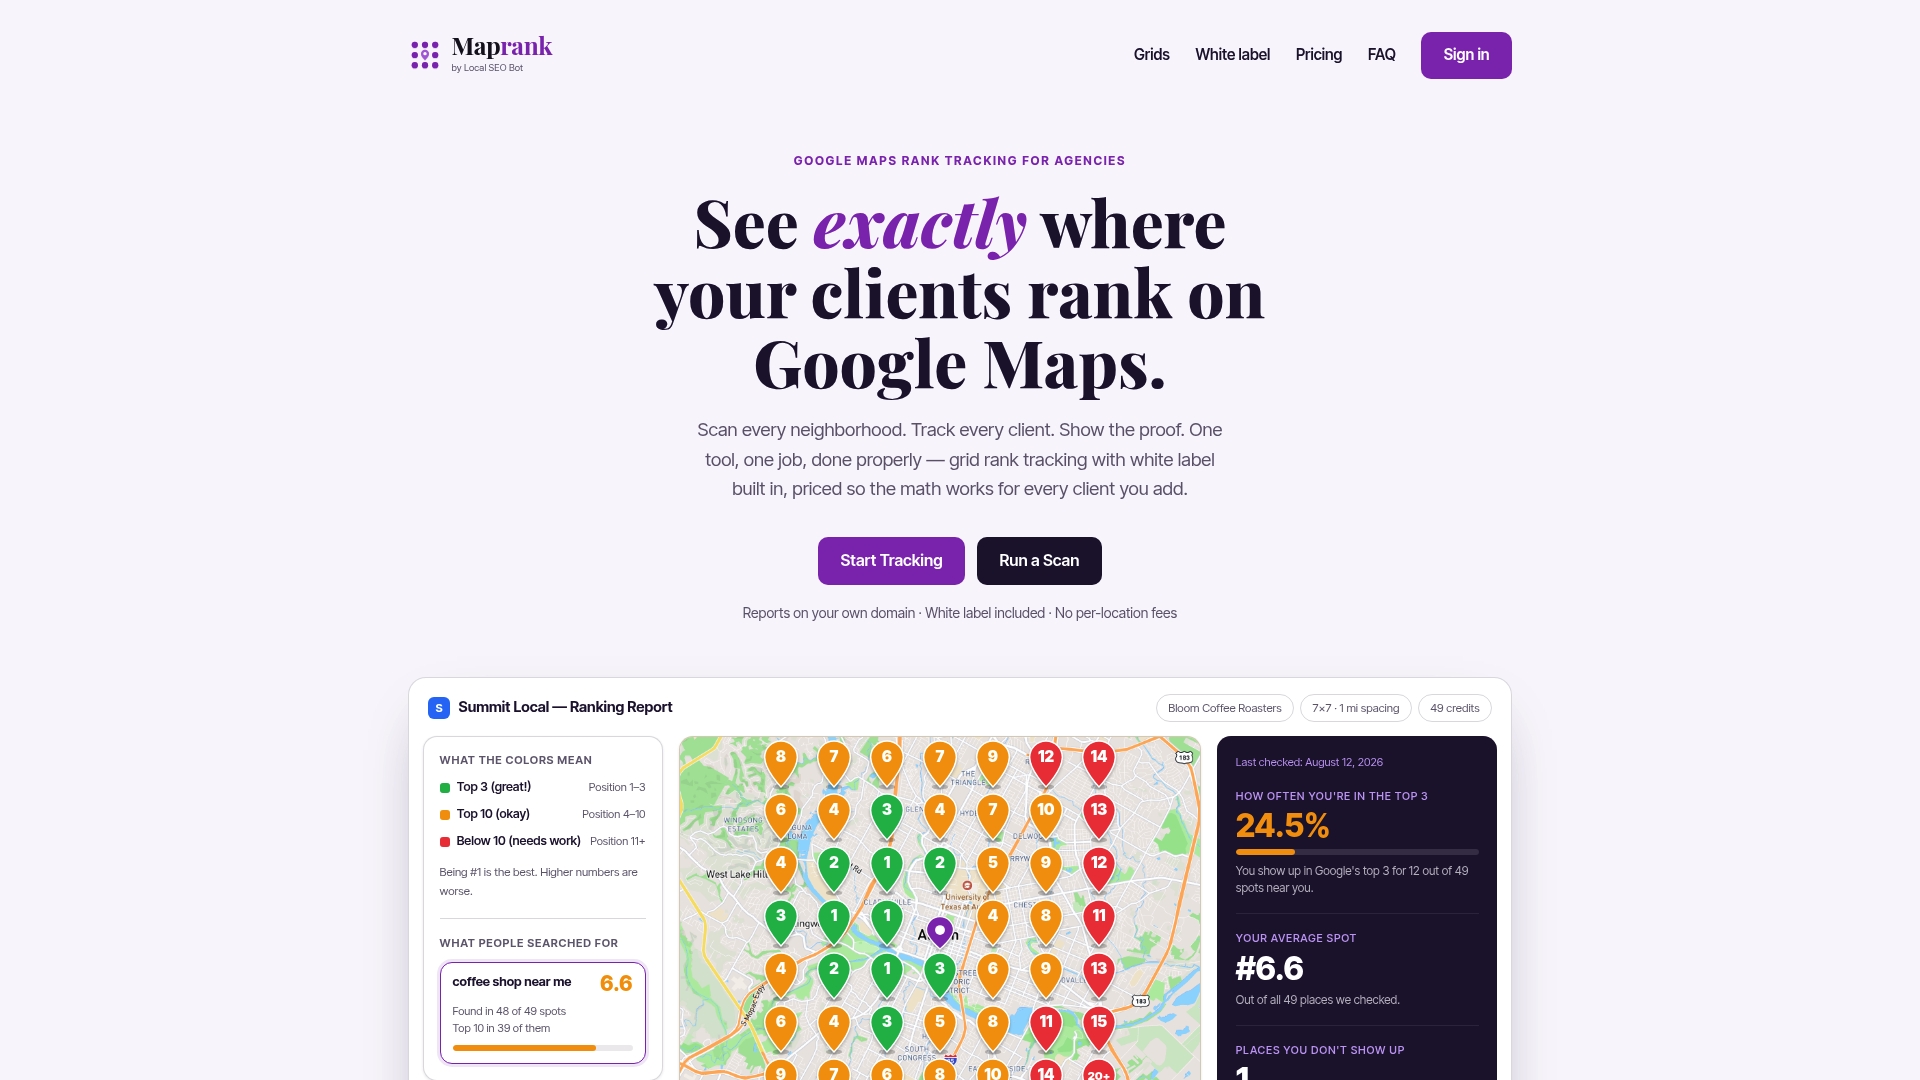
A practical starting workflow: run a sample grid scan on the Google Maps rank tracker, export the CSV into your Google Sheets appendix, paste the results into the field map above, and let your Looker Studio dashboard pull the rest. The white-label local SEO rank tracker plan covers unlimited businesses, so multi-location brands, franchises, and service-area clients all sit on the same account without per-location surcharges. If you’re managing several client accounts and need the report to carry your agency’s branding instead of a vendor’s, start a grid scan and see what the export looks like before you commit to a template build.
Templates and Guides Worth Bookmarking
For building or adapting your own reports, start with Porter Metrics’ Local SEO templates and Whatagraph’s free SEO report template for dashboard structure, SEOReportKit’s sample report for field-mapping ideas, and the 14-point local audit checklist from DeepDiveAudits for AEO and schema recommendations worth folding into your data-quality notes.
Sources
- Best free Local SEO report templates for marketing teams and agencies (2026) - Porter Metrics
- Free SEO Report Template | Client Reports with Examples
- Local SEO Reporting in 2026: Tools and Free Templates to Prove ROI
- Local SEO Report Example & Template for Agencies
FAQ
What Is a Local SEO Report Template?
It’s a reusable structure, usually a Looker Studio dashboard, Google Sheets file, or PDF, that organizes local visibility metrics like map-pack rank, listing actions, and reviews into a consistent, repeatable client deliverable.
What Metrics Matter Most in a Local SEO Report?
Listing actions (calls, direction requests, booking clicks) and grid-based rank visibility matter more than raw traffic, since they tie directly to whether the business is generating real customer contact.
How Often Should Agencies Send Local SEO Reports?
Monthly reporting is the standard baseline, with quarterly reviews for strategic direction and weekly checks reserved for launches or recovery situations.
Can I White-Label a Local SEO Report?
Yes. Tools like Maprank’s local rank tracker let agencies export grid ranking data and brand the resulting reports under their own name instead of the vendor’s.
Do I Need a Google Business Profile Login to Track Rankings?
No. Grid-based tools such as Maprank scan ranking positions across a defined service area without requiring access to the client’s Google Business Profile account.