No GBP Login: Maps Competitor Benchmarking for Agencies with Maprank
No GBP Login: Maps Competitor Benchmarking for Agencies with Maprank

Maps competitor benchmarking reveals neighborhood-level visibility gaps that standard digital audits miss entirely. It compares where competitors actually appear in local search results, block by block, so analysts can spot whitespace and high-pressure zones instead of guessing from citywide averages. According to Google Business Profile guidance, local rankings hinge on relevance, distance, and prominence, and a grid-tracking workflow like the one Maprank runs turns those three factors into prioritized, location-specific actions.
TL;DR:
- Neighborhood-level visibility analysis reveals gaps and high-pressure zones that citywide data overlook, enabling more precise site and ad targeting strategies.
- Key metrics such as local pack presence, share of voice, competitor density, and review signals directly tie into Google’s ranking factors and should be monitored regularly.
- Competitive landscapes differ based on trade-area scope, requiring tailored grid resolution and boundary choices that reflect actual customer travel patterns.
- Running consistent, repeatable grid scans with tools like Maprank supports trackable momentum analysis without incurring per-location fees or requiring Google account access.
- Combining map data with foot-traffic signals and POI datasets ensures a comprehensive view of visibility and the likelihood of converting digital presence into physical visits.
Table of Contents
- Why map-based benchmarking matters for market positioning
- Core metrics to collect and benchmark
- Defining trade areas and building a geo-grid for repeatable benchmarking
- Analytical techniques: turning map data into strategic insight
- Recommended workflow for agencies: a repeatable process
- Analyst perspective: common pitfalls and interpretation traps
- Practical next step: using Maprank to operationalize map-based benchmarking
- Sources
- FAQ
Why map-based benchmarking matters for market positioning
Standard competitor analysis compares websites, ad spend, and messaging. It often misses the question that matters most to a business with physical locations: who shows up when someone nearby searches right now? Map intelligence answers that question at the neighborhood level, which changes decisions that citywide data can’t touch.
Analysts use this granularity to sharpen site selection, redirect ad budgets toward underserved zones, and localize content for specific service areas instead of writing one generic page per city. The stakes are real: a business ranking first in the local pack captures roughly 23.6% of clicks, a share that drops fast for lower positions.
- Site selection improves when analysts see which blocks already have saturated competitor presence.
- Ad targeting gets sharper when spend follows visibility gaps instead of broad radius targeting.
- Local content strategy improves when pages map to zones with measurable competitor weakness.
Core metrics to collect and benchmark
A defensible benchmark needs metrics tied directly to how Google ranks local results, not vanity numbers that look impressive in a slide deck. Google’s own guidance ties ranking to relevance, distance, and prominence, and each factor has a measurable proxy an analyst can track over time.
- Local pack presence: the share of grid points where a business appears in the top three map results, tied directly to click-through potential.
- Geo-grid share of voice: the percentage of scanned points across a trade area where your client outranks each named competitor.
- Competitor density and proximity: how many rival locations sit within a given radius, which affects both distance scoring and foot-traffic overlap.
- Reputation signals: review count and star rating, both documented prominence factors in Google’s ranking guidance.
- Foot-traffic indicators: directional signals from third-party providers that help validate whether visibility gains translate into visits.
One competitor with many more reviews than a rival can dominate a map pack on reputation alone, a pattern that review-volume analysis ties directly to prominence scoring. That single gap often explains more variance in local rankings than distance or category relevance combined.
Defining trade areas and building a geo-grid for repeatable benchmarking
The trade area you choose determines whether your benchmark holds up under scrutiny. A drive-time polygon fits businesses where customers travel meaningfully, a fixed radius fits dense urban cores, and a custom catchment fits businesses with irregular service boundaries like home services or multi-location franchises. The choice should follow the business model, not convenience.
- Match the trade-area type to the customer’s actual travel behavior, not administrative boundaries like zip codes.
- Set grid resolution based on density: tight spacing (block-level) in urban cores, wider spacing (neighborhood-level) in suburban or rural markets.
- Increase sampling density near contested zones where competitors cluster, and reduce it in areas with no relevant competition.
- Document the scoping decision, including why a given radius or grid size was chosen, before running the scan.
Scoping should follow the strategic question driving the benchmark. A market-mapping practitioner guide notes that scoping should consume a meaningful share of project time, since axis and boundary choices anchor everything that follows. A benchmark built to answer “where should we open our next location” needs a different grid than one built to answer “why did we lose visibility last quarter.”
Analytical techniques: turning map data into strategic insight
Raw grid data becomes useful once you layer analysis on top of it. Heatmaps surface demand pockets and hotspots where search volume or competitor density spikes, making it easy to spot where attention is concentrated. Share-of-voice deltas, tracked scan over scan, reveal momentum: is a competitor gaining ground in a specific zone, or is the market stable?

Perceptual mapping, paired with objective point-of-interest metrics, adds another layer. Practitioner guidance recommends combining primary research, such as customer perception, with secondary datasets like POI counts, to avoid conclusions that look statistically clean but miss how customers actually choose between options.
Two signal patterns matter most in practice:
- Opportunity zones: high search demand paired with low competitor prominence, a strong candidate for expansion or targeted content.
- Risk zones: high competitor density paired with weak foot-traffic signals, often a sign of an oversaturated or declining market.
Pro Tip: Run comparative scans on a fixed cadence, monthly for volatile markets or quarterly for stable ones, so deltas reflect real movement rather than noise from a single scan.
Recommended workflow for agencies: a repeatable process
A repeatable benchmarking process turns one-off analysis into a service line. The steps below reflect how agencies typically structure recurring local competitor benchmarks.
- Define the strategic question: expansion, ad targeting, or visibility recovery.
- Select the trade area and grid resolution to match that question.
- Run the initial geo-grid scan to establish a baseline.
- Identify named competitors appearing across grid points and log their density and reputation metrics.
- Analyze opportunity and risk zones using heatmap and share-of-voice deltas.
- Package findings into a client-facing report with clear next steps.
- Re-scan on a fixed cadence to track movement and update recommendations.
Grid-based rank tracking belongs at steps three and seven, since neighborhood visibility only means something when it’s measured the same way twice. Maprank supports this directly: it runs customizable grid scans without requiring Google account integrations, offers white-label reporting so agencies present results under their own domain, includes unlimited businesses on its plans, and prices scans through a per-scan credit model instead of per-location fees.
Pro Tip: Present grid maps alongside a plain-language summary of the top three moves each client should make, since stakeholders act on the narrative more than the map itself.
Analyst perspective: common pitfalls and interpretation traps
The biggest mistake in map benchmarking is choosing axes that confirm a conclusion already decided before the scan ran. Seasonality distorts deltas too: a foot-traffic dip near a competitor might reflect a holiday closure, not a real decline. Always verify whether a listing represents an independent business or a franchise location before treating it as a separate competitor, since misclassified points inflate density counts. Communicate uncertainty plainly. A single scan is a snapshot, not a trend, and stakeholders deserve to know the difference.
— Local
Practical next step: using Maprank to operationalize map-based benchmarking
Once the workflow above is defined, the bottleneck is usually execution: running grids consistently without paying per-location fees that punish agencies for growing. The scanning and reporting layer handles the process so analysts spend time on interpretation instead of setup.
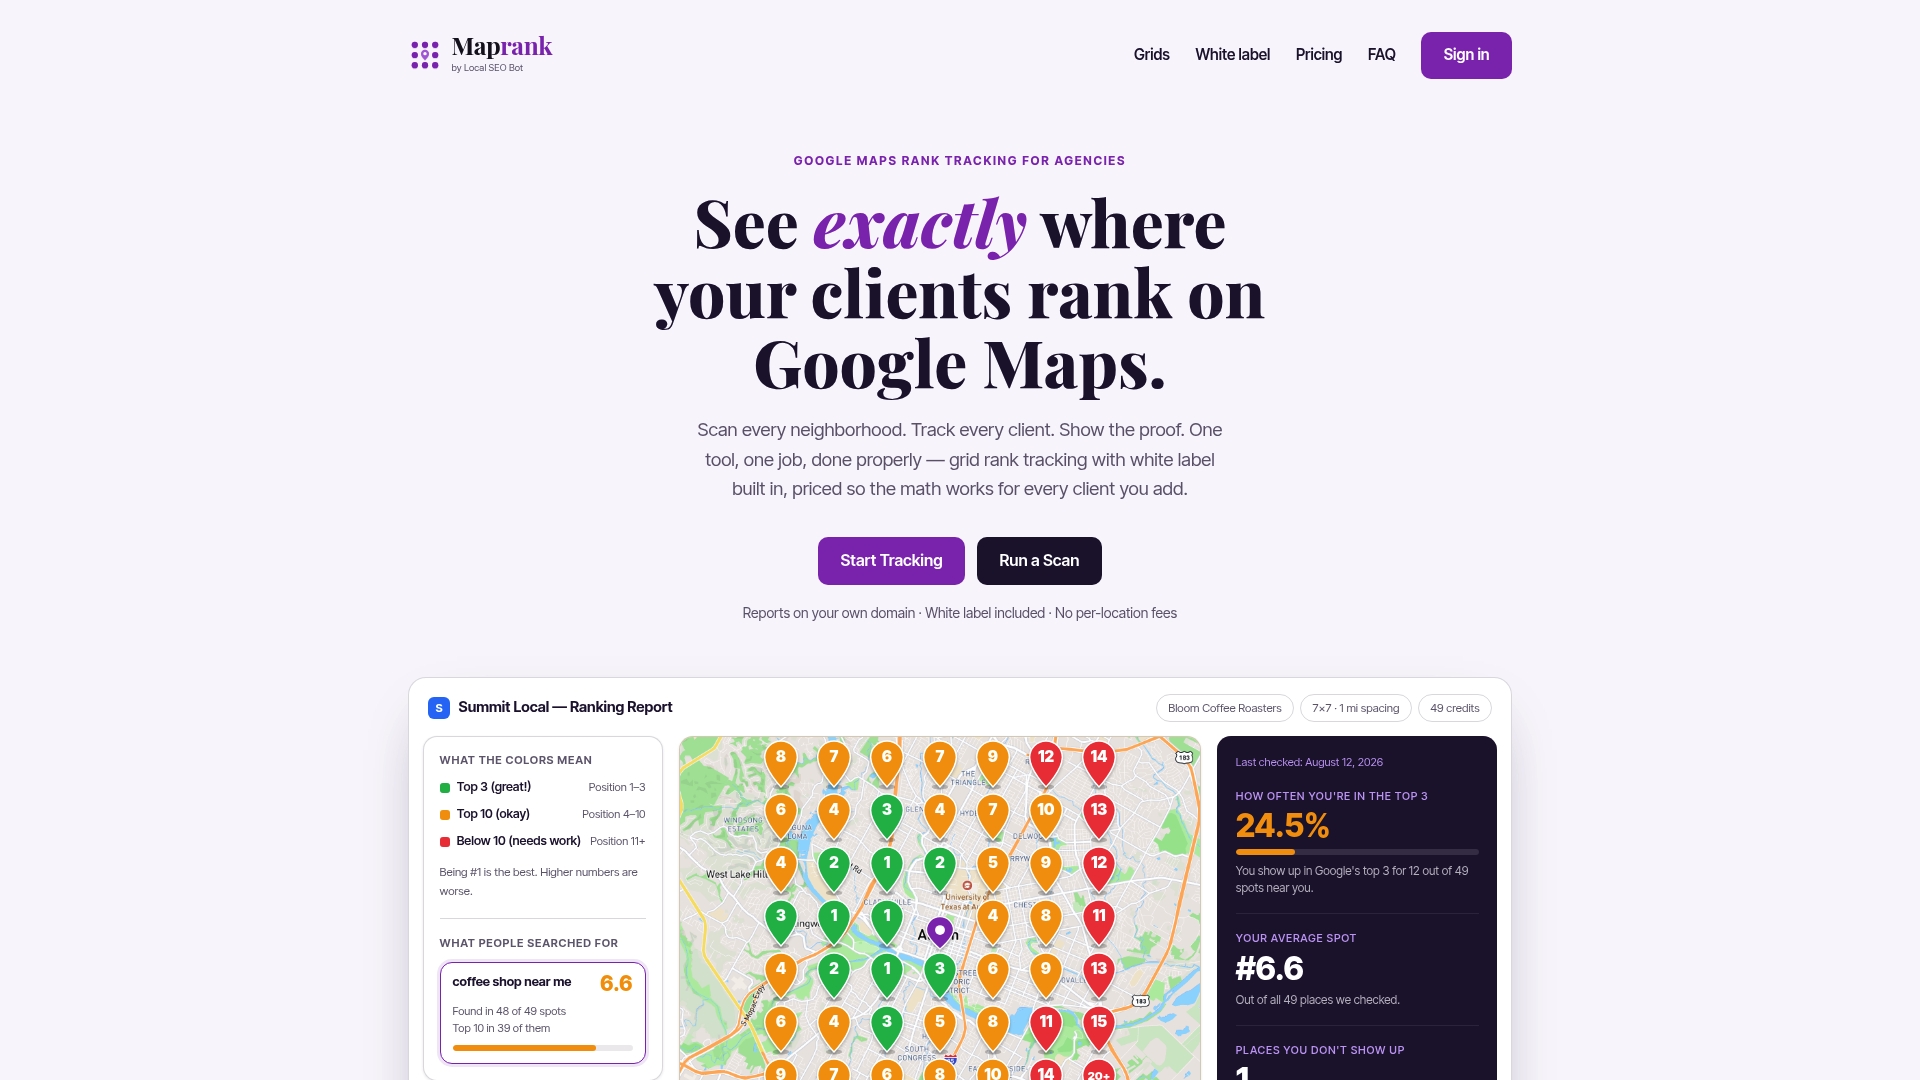
- Grid scans run without Google account integration, allowing quick onboarding of new clients.
- White-label reports are sent under the agency’s own domain, maintaining the client relationship.
- Unlimited businesses are included on all plans, so adding accounts does not trigger additional fees.
Agencies new to the workflow often start with a one-off rank check to prove the concept on a single client before rolling grid tracking out across the book of business. From there, Maprank’s plans scale by scan credits rather than per-location charges.
Sources
Reliable benchmarking depends on triangulating a few source types rather than trusting any single feed. Google Business Profile and Maps data provide the ranking and listing signals that anchor the whole exercise. Foot-traffic vendors add a behavioral layer that shows whether visibility translates into visits. POI datasets fill in competitor counts and category context that neither source covers alone.
- Tips to improve your local ranking on Google - Google Business Profile Help
- Local SEO Statistics: How Local Search Behavior Changed in 2025
- Market Mapping: The Practitioner’s Guide to Competitive Landscape Analysis | Infomineo
Tools built for GBP optimization and auditing help catch listing errors early, which matters because a stale or duplicate listing can quietly distort an entire trade-area comparison.
FAQ
What is maps competitor benchmarking?
Maps competitor benchmarking compares how businesses rank in Google Maps and local pack results across a defined geographic area, rather than relying on a single citywide snapshot. It uses grid scans to reveal block-level visibility differences that standard SEO audits miss.
Which metrics should I track first?
Start with local pack presence, geo-grid share of voice, and competitor density, since these tie directly to Google’s relevance, distance, and prominence factors. Reputation signals like review count add a fast-moving layer worth tracking alongside them.
How often should I re-run a benchmark?
Cadence depends on market velocity: monthly scans suit contested urban markets, while quarterly or semiannual scans fit stable suburban ones, a pattern consistent with standard competitive benchmarking practice. Recurring scans matter more than any single snapshot, since they reveal momentum rather than a static position.
What size grid should I use for a trade area?
Grid resolution should match competitor density: tighter block-level spacing in urban cores, wider neighborhood-level spacing in suburban or rural markets. The choice should follow the strategic question behind the benchmark, whether that’s site selection or ad targeting.
Does Maprank require Google account access to run scans?
No. Maprank runs customizable grid scans without requiring a Google account integration, and it prices scans through per-scan credits rather than per-location fees. All plans include unlimited businesses and white-label reporting on the agency’s own domain.