Stop Guessing: Track Google Maps Rankings for Agencies in 30–90 Days
Stop Guessing: Track Google Maps Rankings for Agencies in 30–90 Days
The fastest way to track true Google Maps visibility is to run geo-grid scans, simulated searches from many GPS points, on a scheduled, browser-based tracker. A single search from your office tells you almost nothing about how you rank three miles away. Tools like Maprank build that grid data automatically and package it into white-label reports agencies can hand straight to clients. The rest of this guide covers setup, evaluation, and reading the results.
TL;DR:
- Running dense, grid-based scans from multiple GPS points reveals hidden ranking differences across neighborhoods, unlike single-point checks.
- Browser automation provides more accurate, real-time Google Maps results compared to API scraping, especially when device and location simulate real user conditions.
- Consistent, scheduled scans with stored history are essential to track ranking trends over time, not just isolated snapshots.
- Effective heatmaps focus on actionable insights, such as proximity and relevance issues, which inform targeted local SEO fixes.
- Agencies benefit from white-label reports and unlimited multi-location support, making it easier to scale and demonstrate progress to clients.
Table of Contents
- What Is Geo-Grid Rank Tracking and Why Does It Matter?
- How Do Professional Rank Trackers Actually Run Checks?
- Which Features Should Agencies Prioritize When Choosing a Tracker?
- How Do You Set Up and Run Your First Geo-Grid Scan?
- How Do You Read a Grid Heatmap and Turn It Into Action?
- What Drives the Cost of a Google Maps Rank Tracker?
- Maprank’s Track Record With Agency Rank Tracking
- How Do Agencies Report Grid Results Back to Clients?
- How Long Does It Take to See Actionable Ranking Data?
- What Mistakes Derail Google Maps Rank Tracking Most Often?
- Agency Perspective: Turning Grid Data Into Retained Revenue
- See Where You Actually Rank With Maprank
- Sources
What Is Geo-Grid Rank Tracking and Why Does It Matter?
Geo-grid tracking runs the same search query from a grid of GPS coordinates spread across a service area, then plots the results into a color-coded map. Grids typically range from small to dense configurations with various grid sizes, and vendors offer square, circle, ZIP-code, or “smart” density modes that add more points around commercial hubs. Each grid point produces a full top-20 result set, not just a yes/no answer, which is what makes the heatmap approach so much more useful than a single rank check.
Google Maps results shift based on proximity, relevance, and prominence, the three factors Google has confirmed shape local rankings, and those factors change block by block. A business can sit in the map pack for searchers two blocks north and disappear entirely for searchers two blocks south. That is not a fluke. It is how proximity-driven local search behaves by design.
Checking from one point creates false confidence. You see a number one ranking from your own desk and assume the whole territory looks the same. It rarely does. A grid scan exposes the blind spots:
- Neighborhoods where you rank on page one versus neighborhoods where you don’t show up at all
- Whether a competitor is winning specific pockets of your service area rather than the whole map
- Which zones justify a dedicated landing page or review push based on real visibility gaps
How Do Professional Rank Trackers Actually Run Checks?
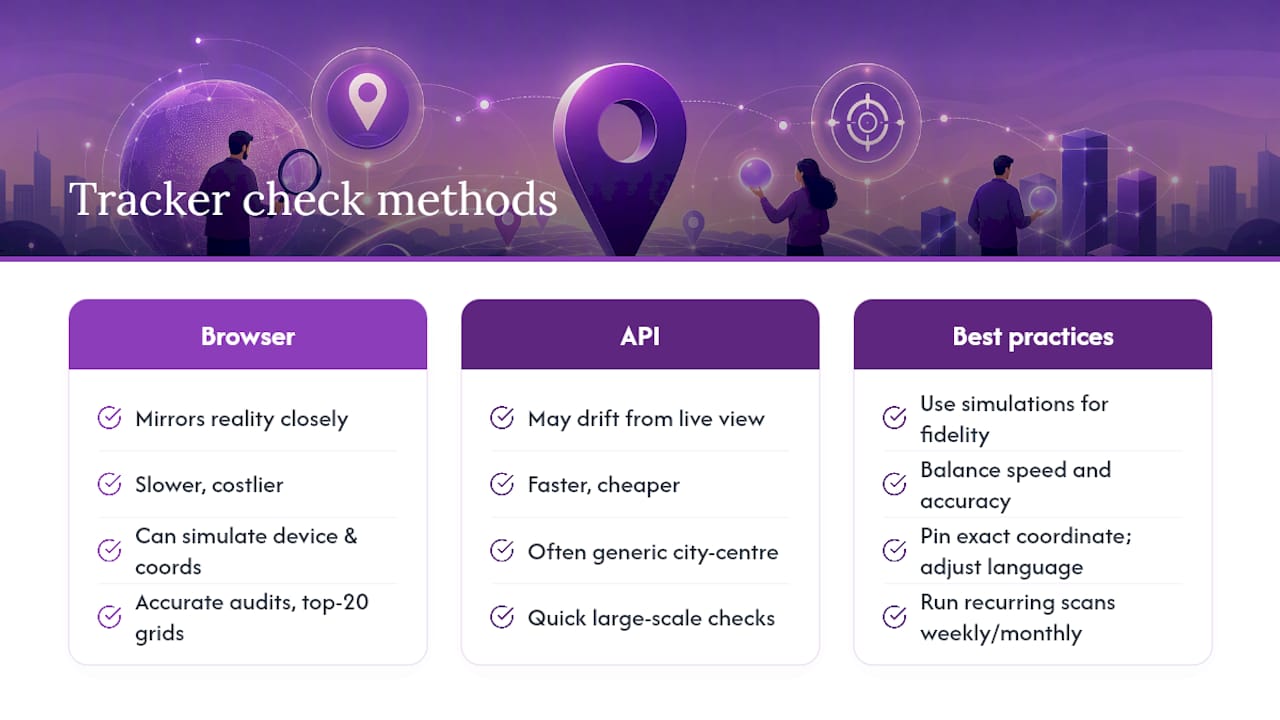
Two very different methods produce Google Maps ranking data, and the gap between them explains why some reports look suspiciously clean while others match what customers actually see. Browser automation opens a real (often headless) browser instance, loads Google Maps or Maps search at a specific coordinate, and reads the rendered results the way a person would. API-based scraping pulls data through backend endpoints that may not reflect the same ranking logic Google shows a live searcher. The former tends to mirror reality more closely; the latter is faster and cheaper but occasionally drifts from what a customer actually sees on their phone.
Device and locale simulation adds another layer of fidelity. Google Maps estimates a searcher’s position using device, browser, and location signals, and improving or simulating that location accuracy directly affects how reliable a scan turns out to be. A tracker that can toggle between mobile and desktop, adjust language, and pin an exact coordinate produces results much closer to what a real customer sees than one that only checks from a generic city center.
Quick fact: Grid-based scanners built on open-source frameworks like the GBP Rank Tracker project demonstrate that full top-20 capture across a 3×3 to 13×13 grid, run through browser automation, is achievable without proprietary black-box methods, a useful benchmark when you’re vetting a paid tool’s claims.
Scheduled scans matter as much as scan quality. A single snapshot tells you where you stand today. A recurring scan, run weekly or monthly and stored as history, tells you whether last month’s citation cleanup actually moved the needle. Without that stored history, every ranking conversation with a client becomes a guess dressed up as an insight.
Which Features Should Agencies Prioritize When Choosing a Tracker?
Vendor selection gets easier once you treat it as a checklist rather than a features page comparison. Here’s what actually separates a tool that scales across a client roster from one that becomes a bottleneck:
- Grid flexibility and sample density. A dense downtown core often needs a 7×7 or larger grid with tight radii between points, while a suburban service area can get useful data from a 3×3 to 5×5 grid centered on commercial hubs and high-value ZIP codes.
- Multi-location support with no per-client penalty. Agencies managing a dozen clients need unlimited businesses on a plan, not a fee that climbs every time they onboard a new account.
- White-label exports that match your reporting workflow. A report a client can’t open, or one still wearing the vendor’s logo, defeats the purpose of buying the tool in the first place.
- Scheduling, API access, and data retention. Confirm how long historical scans are stored; a tool that only shows the last scan can’t prove improvement over a quarter.
- Transparent pricing tied to actual usage. Scan frequency and grid size are the two levers that drive cost most directly, so know how each affects your monthly bill before signing anything.
Pro Tip: Before buying, ask the vendor for a sample white-label PDF, not a marketing screenshot. Half the “reporting” tools on the market export raw grid data with no way to brand it, which forces you to rebuild the report manually every month.
How Do You Set Up and Run Your First Geo-Grid Scan?
A first scan doesn’t need to be perfect. It needs to be repeatable, so every scan after it means something.
- Gather your inputs. Pull the Google Business Profile name or Maps URL, the target keywords a customer would actually type (not just your brand name), the service-area boundaries, and the device type you want to simulate.
- Choose a grid size that matches the terrain. Dense urban blocks generally require larger grids with close points, while spread-out suburban areas typically use smaller grids focused on commercial centers and priority ZIP codes.
- Run the scan and spot-check it. Pick two or three grid points and manually search Google Maps from a phone near those coordinates. If the live results roughly match the scan output, trust the data; if they diverge wildly, check your location or device settings before moving forward.
- Schedule recurring scans. A one-time scan is a snapshot. A weekly or monthly recurring scan is the dataset that actually proves progress.
- Export and archive the baseline. Save the first report as your “before” record, since every optimization conversation you have with a client depends on having that starting point on file.
A few habits make this process far less error-prone:
- Always confirm the business listing pulled into the scan matches the live Google Business Profile exactly, including category and service area
- Re-run a validation spot-check any time you change grid size or add new keywords
- Keep baseline reports in a dedicated folder per client so historical comparisons don’t require digging
How Do You Read a Grid Heatmap and Turn It Into Action?
A heatmap is only useful if you know what the colors are actually telling you. Most tools use a red-to-green scale, red for no visibility or a ranking outside the top 20, yellow for a mid-pack position, and green for a map pack placement. The pattern matters more than any single point.
A ring of red surrounding a green core usually signals a proximity ceiling: you rank well near your physical location, but the relevance and prominence signals aren’t strong enough to carry you further out. Scattered red patches in an otherwise green grid usually point to a relevance problem instead, often a missing service category, thin location pages, or a competitor with denser reviews in that specific pocket.
Match what you see to a specific fix:
- Proximity ceilings often respond to service-area pages built for the underperforming neighborhoods
- Relevance gaps usually trace back to category selection, service list completeness, or GBP description keywords
- Patchy coverage near strong competitors often improves fastest through a targeted review campaign or fresh local citations
Pro Tip: Prioritize fixes by impact times effort, not by whichever grid square looks worst. A single-block red spot next to a busy commercial corridor is often worth fixing before a large but low-traffic red zone on the map’s outer edge.
Measure whether any of it worked with a rescan two to four weeks after the change, paired with real business metrics like phone calls, website clicks, and direction requests pulled from the Google Business Profile dashboard.
What Drives the Cost of a Google Maps Rank Tracker?
Pricing models vary more than most agencies expect, and the differences compound fast once you’re running scans across a full client roster. Some vendors charge per location, which punishes exactly the growth an agency wants to have. Others sell credit bundles consumed per scan, and a smaller number offer flat subscription tiers with seat limits instead.
Three variables drive your actual monthly cost regardless of which pricing model a vendor uses:
- Grid size, since a 13×13 scan consumes far more credits or scan time than a 3×3
- Number of keywords tracked per location, which multiplies the total scan volume
- Scan cadence, where daily scans obviously cost more than weekly or monthly runs
Before signing a contract, ask vendors directly about overage charges once you exceed included credits, whether exported reports remain usable if you cancel, what white-label usage actually includes, and how long scan history stays accessible. Maprank’s pricing structure is built around per-scan credits rather than per-location fees, which tends to reward agencies that add clients rather than penalizing them for growth.
Maprank’s Track Record With Agency Rank Tracking
Some rank trackers face challenges including per-location fees that punish growth and pricing structures difficult to explain to clients in one sentence. A core feature set to look for includes customizable scan grids, white-label reporting, and plans that do not increase costs as more clients are onboarded.
Agencies using grid-based tracking through Maprank report clearer visibility into map pack coverage and faster identification of neighborhood-level gaps competitors are winning. That combination, straightforward pricing plus white-label output, is what agencies consistently point to as the difference between a tool they use once and one they build a reporting workflow around. Readers evaluating the category firsthand can check current rankings directly before committing to a plan.
How Do Agencies Report Grid Results Back to Clients?
Most clients don’t want raw grid data. They want to know two things: are we winning more of the map, and is that worth what they’re paying. Translating a heatmap into that answer is where white-labeling and cadence both matter.
White-label reporting strips the vendor’s branding and replaces it with the agency’s own logo and color scheme, so the client sees a report that looks like it came straight from their marketing team, not a third-party tool. That distinction shapes how the report gets received. A client who sees an unfamiliar tool name in the footer starts asking what they’re paying the agency for; a client who sees their own branding sees the agency’s fingerprints on the result.
Cadence tends to follow a three-tier rhythm across agencies that run this well. Weekly internal checks catch sudden drops fast enough to react before a client notices on their own. Monthly client-facing reports summarize the heatmap in plain language, highlighting which neighborhoods improved and which still need work. Quarterly reviews step back further, tying ranking movement to actual business outcomes like call volume or direction requests, the numbers that justify renewing a retainer.
The report itself works best as three parts: a simple before-and-after heatmap comparison, two or three plain-language takeaways, and a short list of what the agency is doing next. Skip the raw data dump. Clients renew because they understand progress, not because they can read a spreadsheet.
How Long Does It Take to See Actionable Ranking Data?
The first scan happens the moment inputs are set, usually within minutes for a moderate grid size. Actionable data, the kind you can act on with confidence, takes longer, and setting that expectation with a client up front avoids an awkward conversation in week two.
A single scan gives you a baseline, not a trend. You need at least two data points to know whether a position moved, and ideally three or four scans spread across several weeks before drawing conclusions, since local rankings fluctuate day to day even without any optimization work happening. Most agencies find a two-to-four-week window is the minimum before a rescan produces a meaningful comparison.
Bigger shifts, the kind worth mentioning in a client-facing report, generally take longer. Category changes or GBP description edits can shift visibility within one or two scan cycles. Review campaigns and new local citations tend to move rankings more gradually, often across six to twelve weeks, because Google’s local algorithm weighs prominence signals that accumulate rather than change instantly. Landing page work targeting a specific underperforming neighborhood usually lands somewhere in between.
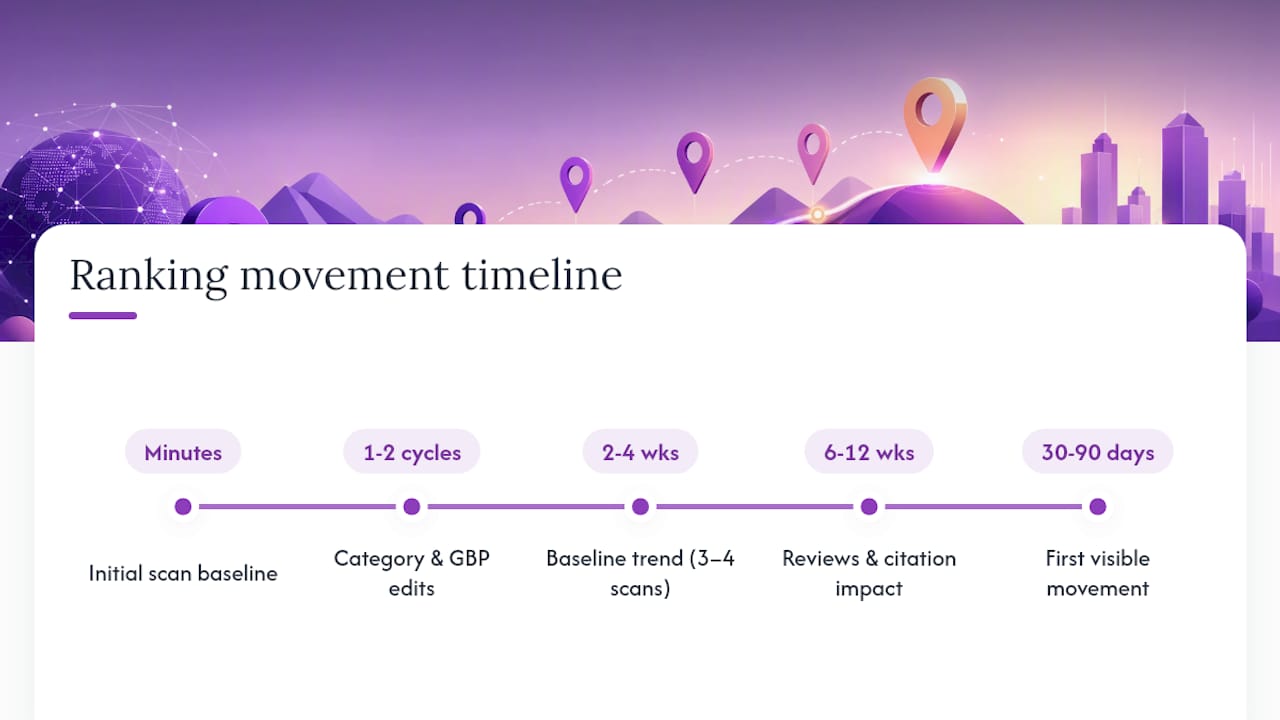
The practical takeaway: set client expectations around a 30 to 90 day window for the first round of visible movement, and use the interim scans to prove the work is happening even before the map pack shifts. A client who sees weekly monitoring and a documented baseline trusts the process more than one who only hears about results after the fact.
What Mistakes Derail Google Maps Rank Tracking Most Often?
The most common failure point is scanning from too few points and calling it a rank check. A grid that is too small and centered only on the business address tells you almost nothing about a wider service radius like several miles; it just confirms what you already knew about your own neighborhood.
Inconsistent device simulation causes a second, quieter problem. Checking desktop results one month and mobile the next produces numbers that look like a ranking swing when it’s really just a measurement change, since mobile queries dominate map-driven local search and often return different results than desktop.
Skipping the spot-check step lets bad data slip through unnoticed. A location input error or a stale GBP category can throw off an entire scan, and without manually verifying a few grid points against live search results, that error compounds across every future report.
Ignoring scan history is the mistake that costs agencies the most credibility. A tool that only shows the current snapshot can’t answer the one question every client eventually asks: is this actually working? Without stored history stretching back at least a few months, there’s no way to prove a trend line rather than a lucky day.
Finally, treating the grid data as the finish line rather than the starting point wastes the whole exercise. A heatmap that gets screenshotted and filed away, with no landing page edit, review push, or citation cleanup attached, is just an expensive way to confirm what a business owner already suspected.
Agency Perspective: Turning Grid Data Into Retained Revenue
The agencies that keep clients longest treat grid scans as a rhythm, not a report. A weekly check on the two or three keywords that drive the most calls, a monthly heatmap summary the client actually reads, and a quarterly review that ties ranking movement to booked jobs. One anonymized pattern shows up repeatedly: an agency that folds grid findings directly into landing page and review sprints sees map pack coverage expand within a single quarter, not because the tool did the work, but because the data told them exactly where to point it.
— Local
See Where You Actually Rank With Maprank
Some tools offer alternatives to juggling per-location fees and unclear pricing tiers that other rank trackers impose on growing agencies. Plans may include features like unlimited businesses, customizable scan grids from small to dense urban configurations, and white-label reports that carry an agency’s branding instead of a vendor’s logo.
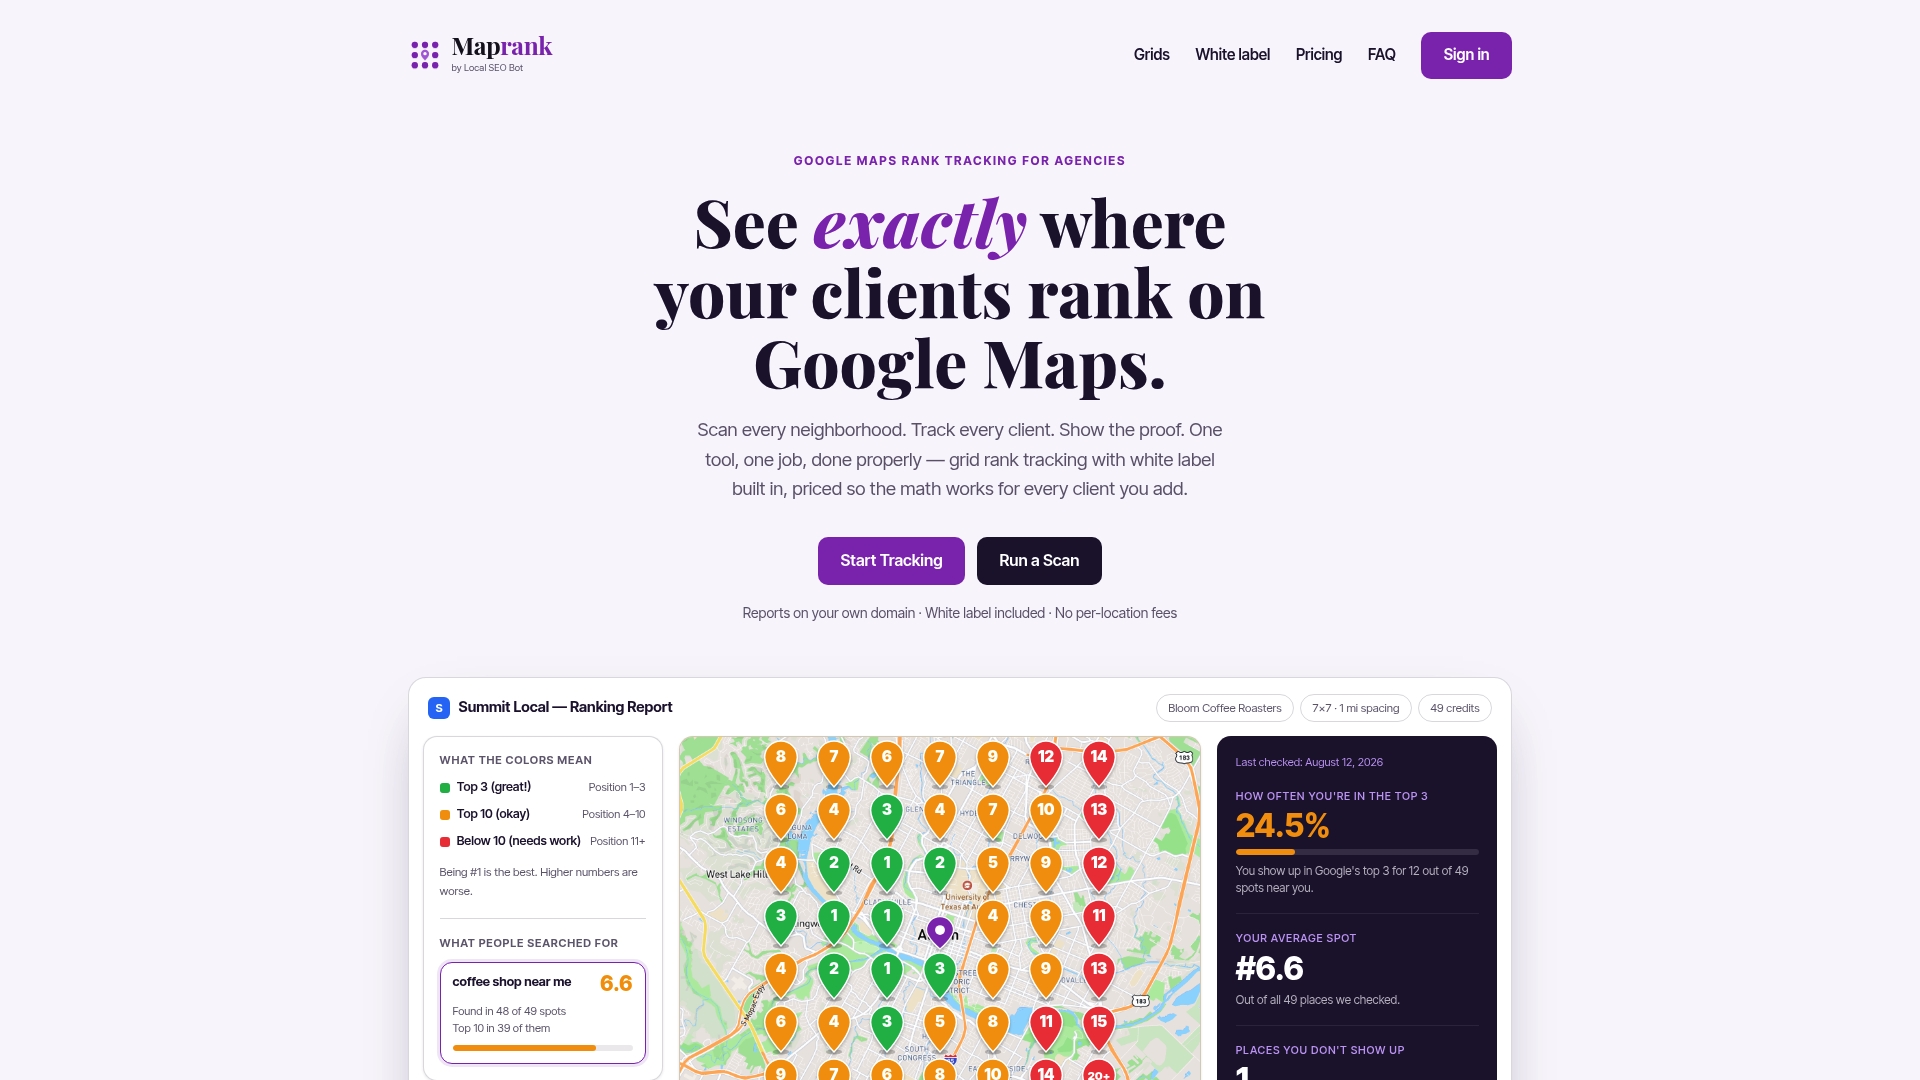
If you’re managing rankings for even a handful of clients, the math on per-location pricing stops making sense fast. Maprank’s grid rank tracker lets you scan a client’s full service area, schedule recurring checks, and export a branded report without renegotiating your plan every time you sign a new account. Agencies weighing options against other tools on the market can also review a side-by-side pricing and feature comparison before deciding.
Run a scan on your own listing or a client’s today with the Google Maps rank checker and see exactly which neighborhoods need work before your next client call.
Sources
- GBP Rank Tracker — Free Google Maps Rank Checker & Local SEO Grid Tool
- Find & improve your location’s accuracy in Google Maps - Computer - Google Maps Help