Reproducible Zip Code Rank Tracking for Agencies, No GBP Login
Reproducible Zip Code Rank Tracking for Agencies, No GBP Login
Zip code rank tracking measures where a business shows up in Google’s organic and Maps results across specific postal areas, and agencies use it to catch neighborhood-level visibility gaps a single city-wide check would miss entirely. It matters most for multi-location brands, service-area businesses, and any campaign targeting a specific zip. The catch: a coordinate-based grid scan gives reliable, comparable results, while checking from one centroid point does not.
TL;DR:
- A coordinate-based grid scan is necessary to accurately measure local ranking variations across zip codes, avoiding misleading single-point centroid checks.
- Sampling 9 to 16 points per zip offers a balance between accuracy and efficiency, with more points needed in urban, competitive markets to capture visibility fluctuations.
- Google Maps local results are heavily influenced by physical proximity, making zip area size and sampling density crucial for reliable rank tracking.
- Tracking should be consistent over time with fixed coordinates, device types, keywords, and settings, to ensure meaningful trend analysis.
- Combining rank coverage data with conversion metrics and performance signals creates actionable insights that improve client reporting and campaign adjustments.
Table of Contents
- What Zip Code Rank Tracking Actually Measures
- How Google Decides Local Results (And Why a Zip Isn’t One Point)
- Why One Centroid Check Isn’t Enough
- How to Set Up a Zip-Level Rank Scan Step by Step
- Turning Grid Scan Data Into Client-Ready Reports
- Best Practices That Keep Zip-Level Reports Trustworthy
- What Grid-Based Tracking Looks Like in Agency Reporting
- Handling Zip Code Data Privacy and Compliance
- Connecting Rank Data to the Rest of Your Analytics Stack
- Software Built for Tracking Rankings by Zip Code
- When to Act on Zip-Level Findings
- See Where Your Clients Actually Rank, Neighborhood by Neighborhood
- Sources
- FAQ
What Zip Code Rank Tracking Actually Measures
Rank tracking by zip code splits into two distinct result types, and mixing them up is the single most common reporting mistake agencies make. Organic blue links follow one set of ranking signals. The local pack and Google Maps results follow another, weighted heavily toward physical proximity. A business can rank third in the local pack from one street corner and disappear entirely four blocks away, while its organic listing barely moves.
Zip-level tracking earns its keep in a few specific situations:
- Multi-location franchises that need to know which stores are losing visibility to newer competitor locations
- Service-area businesses (plumbers, roofers, HVAC companies) that don’t have a storefront but serve defined zones
- Neighborhood-specific campaigns built around a landing page or promotion targeting one part of a metro area
- Agencies managing client portfolios where “we rank well in the city” isn’t a useful enough answer for a client paying for local visibility
The output agencies should expect isn’t a single number. It’s a coverage map showing where the business appears in the top three, a coverage rate across all sampled points, and a distribution that shows how ranking degrades as distance from the business increases.
How Google Decides Local Results (And Why a Zip Isn’t One Point)
Google’s local ranking runs on three factors: relevance, distance, and prominence, according to Google Business Profile Help. Distance carries enormous weight in Maps and local pack results specifically, more than most agencies give it credit for when they’re explaining rankings to clients.
Here’s the detail that changes how you should scan: a zip code is not a coordinate. It’s an area, often several square miles, with variable population density and business clustering. Google’s own location handling backs this up. When a searcher’s device grants permission, Google can use their precise location; without it, Google estimates a general area based on other signals, according to Google Search Help.
That gap between “precise location” and “estimated general area” is exactly why a single rank check from a zip’s centroid tells you so little. A business might dominate the pack near its own front door and vanish for searchers three miles north, inside the same zip. Reporting one number for that entire area either overstates or understates real visibility, depending on where the centroid happens to fall relative to the business.
Coordinate-based scans solve this by sampling multiple specific points instead of guessing at one. Resolution beats convenience here every time.

Why One Centroid Check Isn’t Enough
A single centroid check produces false confidence more often than it produces useful data. The failure mode is predictable: the point sits close to the business, the rank looks strong, and the agency reports “top three in the zip” when the business actually falls out of the pack entirely for large stretches of that same postal area. The reverse happens too. A centroid that lands in a low-density pocket can make a genuinely strong performer look weak.
Multi-point grid scans fix this by sampling ranking at several coordinates spread across the target area, then aggregating the results into something closer to the truth. Point count should scale with how much precision the situation demands:
- Low precision (5 points): fine for a quick directional check or a very small service area
- Standard (9 to 16 points): the working default for most local campaigns, dense enough to catch meaningful variation without burning excess scan credits
- High precision (25+ points): reserved for competitive urban markets or when a client is disputing visibility claims and needs granular proof
Boundary points matter as much as center points. A grid clustered near the business address will always look better than reality, so extend a few points to the edges of the service area, especially toward competitor-dense zones.
Pro Tip: Lock your grid coordinates the first time you scan a location and reuse the exact same points every period after. Changing even a handful of coordinates between scans makes month-over-month comparisons meaningless. You’re no longer measuring rank change; you’re measuring a different sample.
How to Set Up a Zip-Level Rank Scan Step by Step
Reproducibility is what separates a useful zip-level tracking program from a pile of numbers nobody trusts. Every scan needs the same controls recorded every time, or comparisons across periods become guesswork.
- Set fixed coordinates for each point in the grid and never shift them between scans
- Lock the device type (mobile or desktop) since local results can differ between the two
- Choose one search engine and stick with it for the life of the tracking program
- Record language and region settings to match your actual customer base
- Standardize keyword spellings exactly, including local phrasing quirks (“near me,” city names, neighborhood names)
- Set a consistent scan depth (how many results deep you check) and a scan date/time pattern
Coordinate, device, engine, language, and depth all need to stay fixed between scans, or the trend line you’re building becomes noise instead of signal, a point Google Search Help implicitly supports through how differently location-aware results can render.
Keyword selection matters just as much as the technical controls. Most agencies overbuild their keyword lists and end up drowning clients in data nobody acts on. A tighter approach works better: 3 to 5 core keywords per location that map directly to what the business sells, plus a handful of secondary terms only where they’d genuinely change an optimization decision.
Cadence and cost need to move together:
- Run a monthly baseline scan across the full portfolio to catch drift
- Add weekly scans for high-priority zips, recently opened locations, or accounts under active optimization
- Trigger a change-driven scan after any major GBP edit, review spike, or competitor move you’re tracking
Prioritize scan credits toward locations and zips tied to real revenue, not toward blanket coverage that looks thorough on paper but tells you nothing new.
Turning Grid Scan Data Into Client-Ready Reports
Raw rank numbers don’t sell a renewal. The metrics that do are the ones that show a client exactly where they’re winning and where they’re invisible.
Five metrics form the core of a useful zip-level report:
- Top-three coverage: the percentage of grid points where the business appears in positions one through three
- Detected coverage: the percentage of points where the business shows up at all, regardless of position
- Average detected rank: the mean position, calculated only from points where the business was found
- Rank distribution: buckets showing how many points fall into top three, four through ten, and not found
- Point-level win rate: how often the business outranks its closest tracked competitor at each individual point
Average rank alone misleads more than it informs when detection rates are low. A business found at position two on half the grid and completely absent on the other half might report an “average rank of 2,” which sounds excellent and hides half the story, a distortion the Local Agency’s analysis of zip-level visibility calls out directly. Pairing average rank with detected coverage and a distribution breakdown closes that gap.
A practical portfolio scorecard row typically tracks one location against one target zip, and includes:
Heatmaps turn that scorecard into something a client actually understands at a glance, and gap maps overlaying competitor coverage make the sales case for further work almost automatic. Business Profile performance data, aggregated monthly per Google Business Profile Help, adds useful context about calls and direction requests, but it doesn’t replace controlled scans. Treat the two as complementary layers, not interchangeable substitutes.
Best Practices That Keep Zip-Level Reports Trustworthy
The agencies that get real value from zip-level tracking follow a short list of disciplines, and the ones that don’t tend to violate the same handful of rules repeatedly.
Track only what ties to a decision. If a keyword’s ranking movement wouldn’t change what you optimize next, it’s noise in the report, not insight. Keep grids and keyword lists frozen between periods; any change resets your baseline whether you meant it to or not. Prioritize zip coverage by revenue contribution or explicit client goals, since scan credits are finite and spreading them evenly across a portfolio usually means under-sampling the locations that matter most.
The recurring mistakes worth naming directly:
- Shifting grid coordinates mid-series, which breaks trend comparisons without anyone noticing until a client asks why the numbers “jumped”
- Mixing mobile and desktop scans in the same tracked series, since local results render differently between the two
- Reporting average rank as the headline metric without detected coverage alongside it
- Treating a citywide or single-point check as if it applies to every searcher in that city, when Google’s own guidance frames local results as directional, not universal
Pro Tip: Before adding any new zip to a tracking program, ask whether the client can act on what you’ll find there. If the answer is “not really,” spend the scan credits somewhere that moves revenue instead.
What Grid-Based Tracking Looks Like in Agency Reporting
Agencies that shift from single-point checks to coordinate grids typically see the biggest change in how clients react to reports, not in the rankings themselves. A heatmap showing three uncovered neighborhoods next to a thriving downtown core tends to generate a follow-up call. A single “you rank #4” line rarely does.
Maprank was built specifically around this workflow: agencies scanning Google Maps rankings across custom grids without needing Google account integrations for every client location. That matters operationally, since account-linking requirements are one of the biggest friction points in onboarding new local SEO clients.
A few things worth knowing about how this plays out in practice:
- Reports can go out on the agency’s own domain, branded and white-labeled, so clients see the agency’s identity, not a third-party tool’s
- Unique features include customizable scan grids and unlimited businesses tracked per plan, which matters for agencies managing dozens of locations without per-location fee surprises
Handling Zip Code Data Privacy and Compliance
Zip codes sit in an interesting gray zone for data handling. On their own, they’re aggregate geographic identifiers, not personal data tied to an individual. But agencies still need to be careful about what surrounds that zip data in a reporting workflow.
The main exposure point isn’t the zip code itself; it’s what gets bundled alongside it. If a report combines zip-level rank data with customer address lists, call logs, or CRM exports tied to individual people, that combination can trigger data protection obligations depending on jurisdiction, particularly under frameworks like the EU’s GDPR or state-level laws such as the California Consumer Privacy Act. Rank tracking data pulled from public search results carries far less risk than customer-identifiable data, but agencies handling both in the same client dashboard should keep them logically separated.
A few practical habits reduce risk without slowing down reporting:
- Store scan point coordinates as business-area identifiers, not linked to any individual searcher or customer record
- Avoid pulling personally identifiable click or call data into the same export as grid scan results unless there’s a clear, disclosed purpose
- Check any third-party rank tracking tool’s data retention and storage policy before feeding client zip data into it
- Disclose to clients, in plain terms, what location data gets collected and how long it’s retained
None of this makes zip-level tracking risky by nature. Public search result data collected through automated location-restricted queries is a fundamentally different category from customer personal data, and treating them as separate streams in your reporting pipeline keeps compliance simple.
Connecting Rank Data to the Rest of Your Analytics Stack
Zip-level rank data becomes far more useful once it stops living in isolation. On its own, a coverage map tells you where visibility exists. Paired with conversion data, it tells you where visibility is actually worth pursuing further.
The most valuable integration point is usually call tracking and form-fill data by location. If a zip shows strong top-three coverage but zero conversions, that’s a landing page or offer problem, not a ranking problem. If a zip shows weak coverage but disproportionate conversions from the traffic that does land, that’s a zip worth fighting harder for.
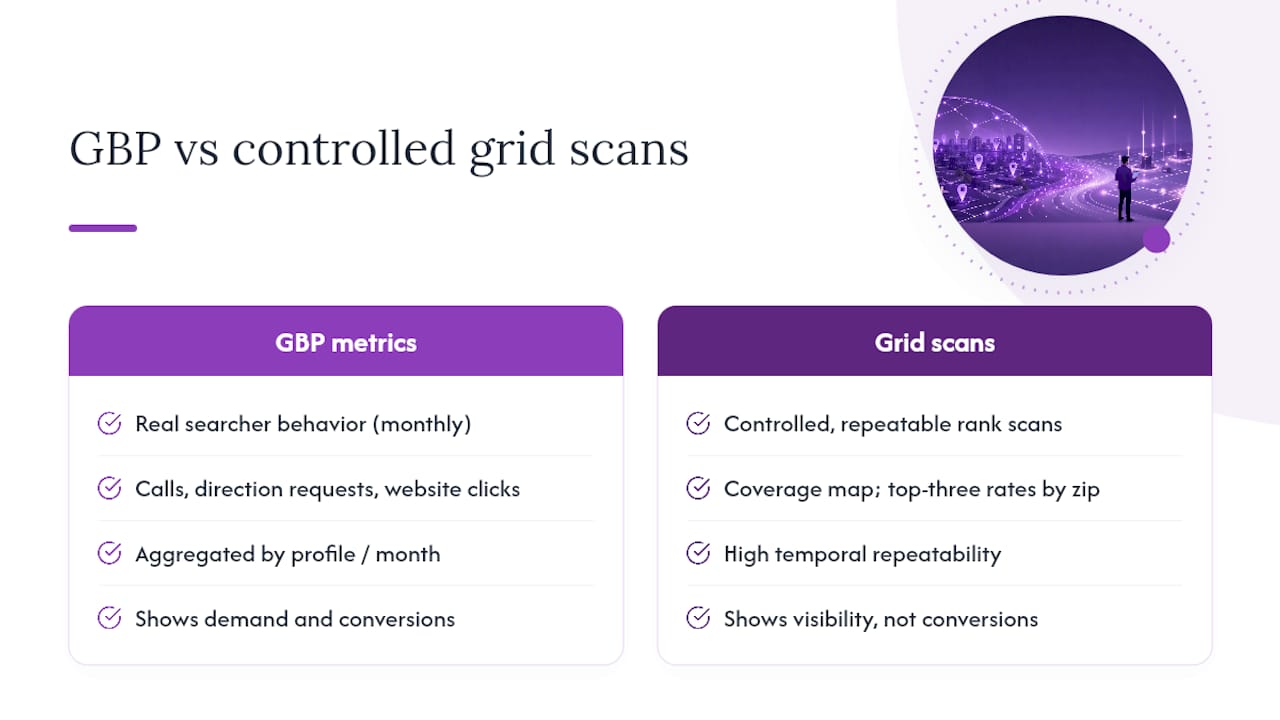
Google Business Profile performance metrics, covering calls, direction requests, and website clicks, add another layer, though they measure something distinct from controlled rank scans and shouldn’t be conflated with them. GBP data reflects real searcher behavior aggregated monthly; grid scans reflect controlled, repeatable measurement of ranking position. Reporting both side by side, clearly labeled as separate data sources, gives a fuller picture than either one alone.
Beyond that, feeding zip-level coverage rates into a broader marketing dashboard, alongside paid search performance, review velocity, and site traffic by geography, lets agencies build a genuinely location-aware view of account health. A location with declining top-three coverage and a drop in review velocity in the same period is a much stronger signal than either metric flagged separately. Most agencies already have the analytics infrastructure to support this; the missing piece is usually just exporting grid scan results in a format (CSV, API feed, or shared dashboard) that plays well with whatever reporting tool the team already lives in day to day.
Software Built for Tracking Rankings by Zip Code
Not every rank tracker handles zip-level granularity the same way, and the differences matter more than most buying guides admit. Some tools check rankings from a single approximate location per keyword and call it local tracking. Others build true coordinate grids, sampling multiple points across a defined area and reporting coverage as a spatial pattern rather than one number.
The distinction to look for when evaluating options: does the tool let you place and reuse specific coordinates, or does it estimate from a zip centroid automatically? Centroid-only tools will always understate the complexity that Google’s relevance, distance, and prominence model creates across a wide postal area. Grid-based tools, by contrast, let you decide exactly how dense your sampling needs to be for a given market.
Pricing structure matters just as much as technical capability for agencies managing client portfolios. Per-location fees scale badly once an agency crosses even a dozen tracked businesses, which is why credit-based models, where scan volume rather than business count drives cost, tend to fit agency economics better. Look for customizable grid sizing, white-label reporting options, and no requirement to connect each client’s Google account individually, since that last requirement alone kills a lot of onboarding momentum.
A roofing and storm-damage lead generation case shows how sharply local visibility priorities can vary by market and season, which is exactly the kind of variance flat, city-wide tracking tools tend to flatten out entirely.
When to Act on Zip-Level Findings
Not every gap needs an immediate response. Monitor small dips; act when a whole neighborhood drops out of the top three or a competitor takes visible ground. That’s when a GBP category fix, a localized landing page, or a review push earns its place on this week’s task list, not next quarter’s.
— Local
See Where Your Clients Actually Rank, Neighborhood by Neighborhood
Maprank is the practical alternative to piecing together spreadsheets from a tool that only checks one point per keyword. It builds the exact coordinate grids this guide describes, without asking you to connect a Google account for every client location you manage.
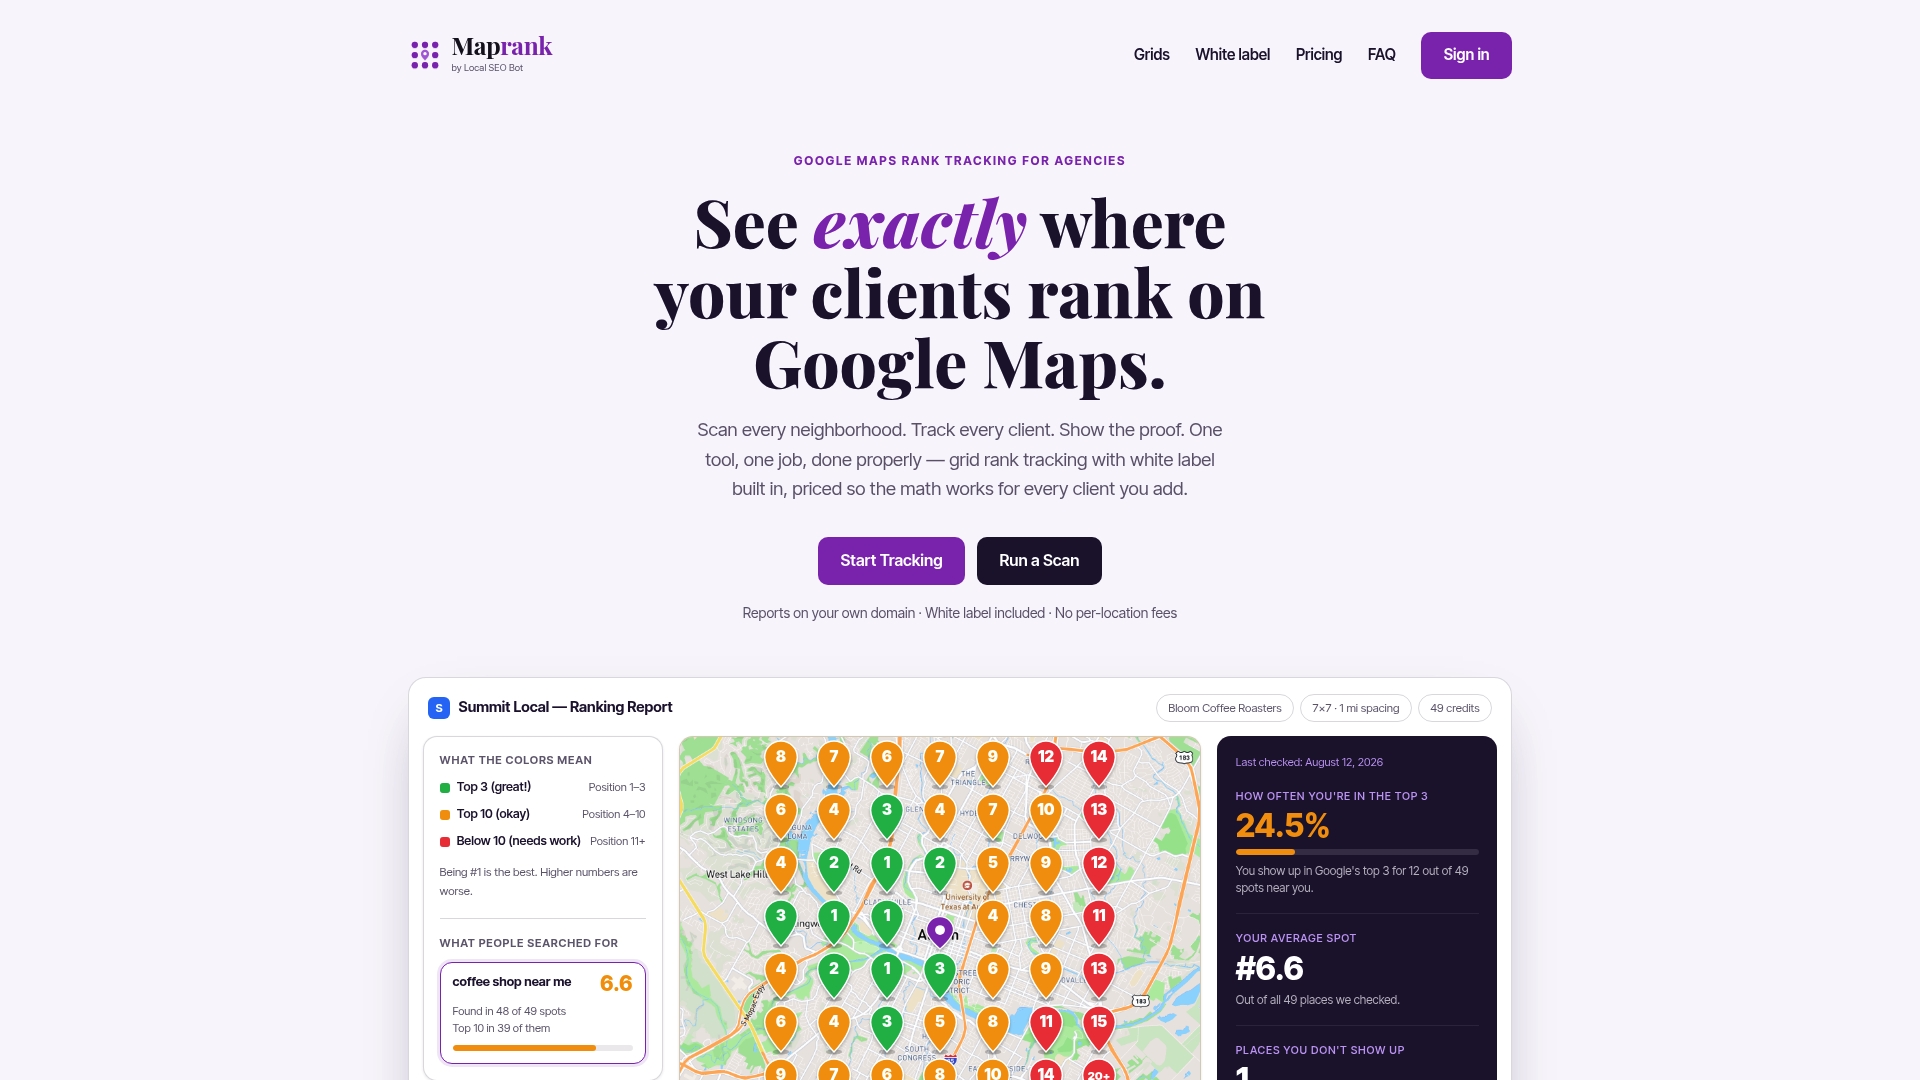
Reports go out white-labeled on your own domain, every plan includes unlimited tracked businesses, and pricing runs on scan credits instead of per-location fees that punish growth. The Maprank Solo plan starts at $19 a month for agencies just building out their first grid programs, with Agency, Pro, and Scale tiers available as your portfolio grows. If you want to see what a grid scan actually reveals before committing to a plan, run a one-off rank check on a single location first and look at the coverage map it produces.
FAQ
What Is Zip Code Rank Tracking?
Zip code rank tracking measures where a business appears in organic or local pack results within a specific postal area, usually by sampling multiple coordinate points rather than checking from one location. It reveals visibility variation across a zip that a single city-wide rank check would hide entirely.
How Many Grid Points Should I Use Per Zip?
Nine to sixteen points works as a standard default for most local campaigns, while five points suffices for a quick directional check and 25 or more suits competitive urban markets needing high precision. Boundary points toward the edges of a service area matter as much as points near the business address.
How Often Should Agencies Run Zip-Level Scans?
A monthly baseline scan across the full portfolio catches general drift, while weekly scans fit high-priority zips or recently changed locations. Change-driven scans after a major GBP edit or competitor move round out a cost-effective schedule.
Can Maprank Track Rankings Without Connecting a Client’s Google Account?
Yes. Maprank runs grid-based Maps rank tracking without requiring Google account integrations for each client, and it supports unlimited tracked businesses on every plan alongside white-label client reports.
Does Average Rank Alone Tell the Full Story?
No, average rank can mislead badly when detection rates are low, since it only reflects points where the business was found at all. Pairing it with detected coverage and a rank distribution breakdown gives a far more accurate picture of real visibility.