Prove Map Pack Coverage: Franchise Location Tracking for Agencies
Prove Map Pack Coverage: Franchise Location Tracking for Agencies

Franchise location tracking means running a grid of simulated search points across every neighborhood a client operates in, then measuring exactly where each location shows up in Google Maps for its target terms. Agencies should run it whenever a client has more than a handful of locations, operates in dense or overlapping service areas, or needs proof of Map Pack visibility beyond a single “we rank #1” screenshot. Before scanning, audit the Google Business Profile data. Then scan.
TL;DR:
- Grid scans are essential for franchises with five or more locations in overlapping markets to identify coverage gaps and cannibalization issues.
- Dense urban areas require tighter grid spacing, while suburban and rural locations can use wider spacing, depending on market stability and service radius.
- Regular profile audits and data hygiene are necessary, as changes or inconsistencies in business information can cause false coverage drops in scans.
- Heatmaps and neighborhood rank distributions help visualize underperforming areas and track progress over time with trend analysis.
- Maprank’s credit-based, unlimited-business plans simplify scaling and allow agencies to provide branded reports without additional costs for new locations.
Table of Contents
- What Grid-Based Franchise Location Tracking Actually Measures
- When Multi-Location Clients Actually Need Grid Scans
- How to Set Up and Scale Grid Scans Across Franchise Locations
- Metrics and Reports That Actually Move Franchise Clients
- How Agencies Use Maprank for Franchise Location Tracking
- Connecting Grid Data to the Rest of Your Marketing Stack
- What Recent Local Algorithm Changes Mean for Tracking Franchises
- The Mistakes That Quietly Sink Franchise Tracking Programs
- Get Started Tracking Franchise Locations With Maprank
- Sources
- FAQ
What Grid-Based Franchise Location Tracking Actually Measures
A scan grid is a set of virtual search points laid over a map, each one pinging Google Maps as if a real searcher stood at that exact spot and typed a keyword. Instead of one rank number, you get dozens, sometimes hundreds, of data points showing how visibility shifts block by block.

That variation isn’t noise. Google has stated plainly that local results are ranked by relevance, distance, and prominence, and there’s no way to pay your way past those three factors. A grid scan is really a distance test run at scale: it shows you exactly where a franchise location stops winning the Map Pack simply because a searcher is standing four blocks farther away, and where prominence signals (reviews, citations, category accuracy) are strong enough to overcome that distance.
Grid density should match how competitive the market is:
- Dense urban cores (multiple locations within two miles): tighter grids, smaller cell spacing, more points per square mile.
- Suburban or exurban markets: wider spacing, fewer points, since visibility tends to hold steady over longer distances.
- Mixed-density franchise networks: variable grid sizes per location rather than one template applied everywhere.
When Multi-Location Clients Actually Need Grid Scans
A single rank check tells you a location ranks third for “auto repair near me” from one point on the map. It doesn’t tell you that the same location drops to eleventh two neighborhoods over, while a sister location twelve miles away holds top-three across its entire service radius. That gap is invisible without a grid, and it’s exactly the kind of thing franchise owners notice in their revenue before they ever mention it to you.
Three factors should drive the decision to run grid scans on a client:
- Location count. Once a brand has five or more locations, per-location manual checks stop scaling and start missing real coverage gaps.
- Market density. Franchises packed into overlapping metro areas (think multiple locations of the same chain in one city) need grids to catch cannibalization between their own units, not just competitors.
- Client KPIs tied to visibility. If a client’s success metric is calls, walk-ins, or bookings from a specific trade area, rank at one center point tells you almost nothing about that area’s edges.
Watch for operational signals too: a franchisee complaining that “the app shows we’re not even on the map” from certain parts of town, or a sudden dip in leads from one zip code while others stay flat. Both are grid problems disguised as complaints.
Pro Tip: Run a baseline grid scan before onboarding any new franchise client, even if they haven’t asked for one. It gives you a documented starting point to prove improvement later, and it often surfaces a coverage gap the client didn’t know existed.
How to Set Up and Scale Grid Scans Across Franchise Locations
Setting up grids for one location is simple. Doing it for forty locations across a franchise network is where most agencies either build a repeatable system or drown in spreadsheets. Here’s the sequence that scales.
- Plan the grid shape before you plan anything else. Pick a radius that reflects the client’s actual service area, not an arbitrary default. A dense downtown location might need a one-mile radius with tight cell spacing; a rural location might need five miles with wider gaps.
- Match cell spacing to city layout. Grid points in a grid-pattern city (think a Midwestern downtown) can follow straight lines. Points in a coastal or hill-town layout need to follow the actual road network and population clusters, not a mathematical square.
- Batch by market, not by client. Group scans by metro area so you can run and compare multiple franchise locations in the same city on the same schedule, rather than treating each unit as an isolated job.
- Set cadence by volatility. Stable suburban locations might only need monthly scans. Locations in competitive urban corridors, or ones mid-way through a review campaign, deserve weekly or biweekly scans.
Before any scan runs, fix the data underneath it using resources like Google Business Profile Optimization: A Checklist for More Local Customers:
- Confirm every Google Business Profile uses a consistent name, category, and complete street address across the entire franchise network, since Google’s own multi-location guidelines warn that an incomplete address can get a listing pinned incorrectly on the map.
- Use precise geo coordinates, ideally to at least five decimal places, matching Google’s structured data guidance for LocalBusiness markup on each location page.
- Match every physical location to its own dedicated page on the client’s website, not a shared “locations” page that dilutes relevance signals.
Once the grids are clean, automation earns its keep.
Metrics and Reports That Actually Move Franchise Clients
Franchise owners don’t think in rank positions. They think in “are we visible where our customers are.” Translate grid data into these core metrics, and reports stop feeling like SEO jargon and start feeling like business intelligence:
- Map Pack coverage percentage: the share of grid points where the location appears in the top three Map Pack results.
- Neighborhood rank distribution: a breakdown showing where the location ranks strong, average, or weak across the grid, not just an average score.
- Visibility share: how much of the total local search visibility in a market belongs to this location versus competing locations, including sister units.
- Review velocity: the pace of new reviews relative to competitors, since Google draws on user-contributed signals like reviews when populating and ranking profiles.
Heatmaps do more work than a table of numbers ever will. A red-to-green gradient over a real map instantly shows a franchise owner which zip codes are underperforming, which distribution bands cluster around the top three spots, and which ones fall off entirely past a certain radius. Pair that with a trend line over 90 days, and a client can see whether a coverage decline is a blip or a pattern.
Either way, the fix starts with the profile, not the content.
How Agencies Use Maprank for Franchise Location Tracking
Grid tracking only works at scale if the tool behind it doesn’t punish you for having more clients. Maprank was built around that specific problem: agencies running rank checks across dozens or hundreds of franchise locations without per-location fees stacking up.
- Customizable scan grids let you match cell density to each market, from tight urban grids to wide suburban ones, without switching tools.
- White-label reporting puts every chart and heatmap on the agency’s own domain, so franchise clients see your brand, not Maprank’s.
- Unlimited businesses are included on Maprank’s plans, which matters directly for agencies onboarding new franchise locations mid-contract.
- Credit-based pricing means scans cost credits, not per-location subscriptions, so adding a fortieth location doesn’t require a new pricing conversation with the client.
That structure is also why agencies use Maprank’s grid rank tracking to find market gaps client teams didn’t know existed, then hand over a white-label PDF that documents the exact neighborhoods where visibility needs work. No Google account integration is required to run the scans, which keeps client onboarding simple when a franchise has dozens of separately managed profiles.
Connecting Grid Data to the Rest of Your Marketing Stack
Grid scan data is only half useful sitting inside a rank tracker. Its real value shows up when it’s cross-referenced against the metrics a franchise client already watches, like call tracking, booking software, and CRM lead sources. A neighborhood with weak Map Pack coverage and a matching drop in call volume from that zip code isn’t a coincidence. It’s confirmation that local visibility is a leading indicator, not just a vanity metric.
Agencies that build this connection well tend to export grid results as CSVs or through white-label PDFs and layer them into a client’s existing business intelligence dashboard, whether that’s a spreadsheet, a Looker Studio report, or a CRM with custom fields. The goal is putting rank coverage next to revenue-adjacent metrics in the same view, so a franchise owner comparing three regional managers can see visibility and lead volume side by side instead of in two disconnected reports.

Structured data plays a quiet role here too. LocalBusiness markup won’t move a Map Pack ranking directly, but accurate schema across every franchise location page makes it easier for other systems, from Google’s own knowledge panels to third-party citation aggregators, to read consistent business details. That consistency indirectly supports the prominence signals grid scans are measuring in the first place.
The practical move for most agencies is simple: treat grid coverage as one more column in the client scorecard, right next to lead volume, review count, and ad spend, rather than a separate report nobody cross-checks against the numbers that actually matter to the franchise owner.
What Recent Local Algorithm Changes Mean for Tracking Franchises
Google’s local ranking system hasn’t abandoned relevance, distance, and prominence as its foundation, but the weight given to profile accuracy and review signals has tightened. Franchise networks with duplicate listings, inconsistent categories, or stale hours are more exposed now than a few years ago, because Google leans harder on user-contributed data and licensed third-party sources to fill in gaps when owner-provided information looks unreliable.
That shift matters directly for grid tracking. A location that scanned well six months ago can lose Map Pack coverage without any change to its actual rank algorithm exposure, simply because a competitor’s profile became more complete or a duplicate listing started splitting review signals. Agencies that scan on a fixed schedule, without re-auditing profile data periodically, will misread those drops as ranking penalties when the real cause is a data hygiene issue on the client side.
The practical response is to treat profile audits and grid scans as a paired process, not two separate tasks on different calendars. Re-check business names, categories, and address formatting every time coverage drops unexpectedly, before assuming the algorithm itself moved against the client. Franchise networks that keep a canonical, de-duplicated list of every location, matched one-to-one with a dedicated page on the client’s website, tend to weather these local search shifts with far less volatility than networks managing profiles ad hoc across dozens of individually run listings.
The Mistakes That Quietly Sink Franchise Tracking Programs
The biggest failure point isn’t the grid. It’s the data feeding it. Inconsistent Business Profile names and categories across locations poison scan results before a single point pings the map. Low sampling density is the second killer: agencies run five grid points where they needed thirty, then report false confidence to a client whose actual coverage gap sits between those points.
Suite-level differences matter more than most agencies assume, especially in shared office buildings or strip malls where two franchise tenants share a street address. Run weekly spot checks on any location that changed category, moved suites, or picked up a competitor within a half mile. That habit catches problems before a client notices the revenue dip.
— Local
Get Started Tracking Franchise Locations With Maprank
Some rank tracker pricing punishes agencies when they’re growing, adding new franchise clients, or expanding into new metros. Grid rank tracking, white-label reports on your own domain, and unlimited businesses can come standard, so scaling from ten locations to two hundred doesn’t always require renegotiating a subscription.
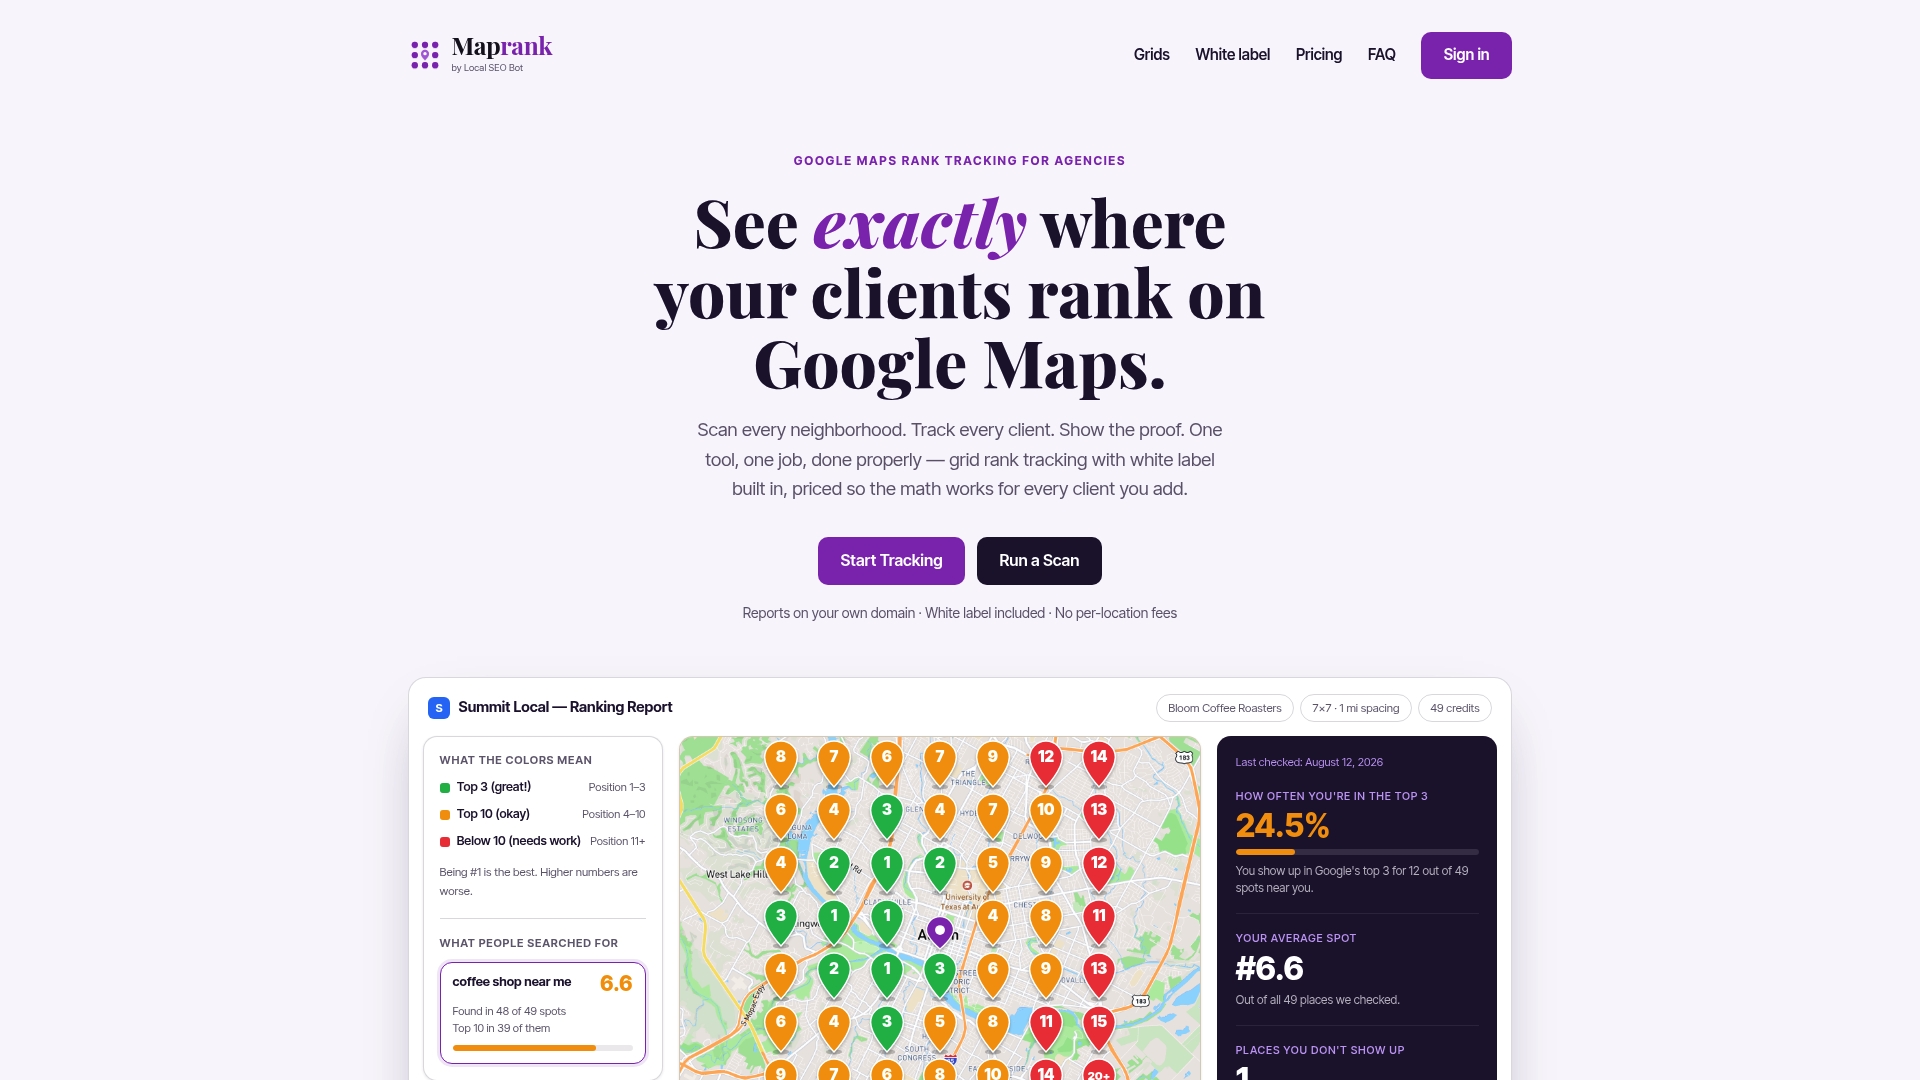
If you want to see how a franchise location actually performs across its service area before committing to a subscription, start with a one-off rank check on a single client. If you’re closer to pitching a new franchise account, pull a couple of white-label report examples to show what the client-facing output actually looks like. Either way, the next step is the same: run the scan, see the map, decide from there. Get started at Maprank.
Sources
- Tips to improve your local ranking on Google - Google Business Profile Help
- Local Business (LocalBusiness) Structured Data | Google Search Central
FAQ
What Is Grid-Based Franchise Location Tracking?
It’s a method of checking Google Maps rankings from many points across a service area instead of one central point, revealing how visibility shifts by neighborhood. Agencies use it to catch coverage gaps that a single rank check would miss entirely.
How Is Grid Tracking Different From a Regular Rank Check?
A regular rank check gives you one number from one point on the map, usually the business address itself. A grid scan runs dozens of simulated searches across a radius, showing exactly where a location wins the Map Pack and where it drops off due to distance or weaker prominence signals.
How Many Grid Points Does a Franchise Location Need?
There’s no fixed number, since it depends on market density and service radius. Dense urban locations typically need tighter grids with more points per square mile, while suburban or rural locations can use wider spacing with fewer points.
What Does Maprank Cost for Agencies Tracking Multiple Franchise Locations?
Maprank runs on credit-based pricing, with Maprank Solo starting at $19 per month, Maprank Agency at $39 per month, Maprank Pro at $79 per month, and Maprank Scale at $149 per month, all including unlimited businesses. Annual billing is available on every plan at a reduced effective rate.
How Often Should Agencies Re-Scan Franchise Locations?
Cadence should match volatility: stable suburban locations can be scanned monthly, while competitive urban markets or locations mid-campaign often need weekly or biweekly scans. Setting automated alerts for coverage drops catches problems between scheduled scans.